Avon Products (AVP) is showing whipsaw behavior following the recent shooting star candlestick that was registered when the stock attempted to break out of its recent trading range.
Of all of the major US equity indices it is the chart for the S&P 400 Midcap index (^MID) which reveals the most striking buy channel since the March lows. The index continues to push ahead of the pack but is now reaching towards levels where there is considerable chart resistance. 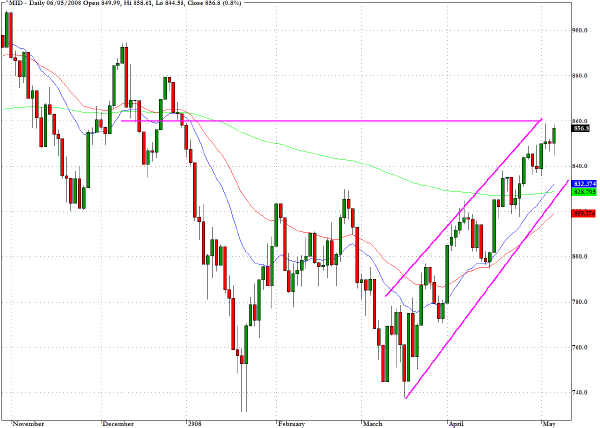
Crude oil is breaking to new all-time high price records on an almost daily basis and the news yesterday from Goldman Sachs analysts that $200 a barrel could be on the horizon provided a spur for the entire energy sector.
The chart for the Amex Oil index (^XOI) reveals a series of cup/handle formations with the characteristic pattern that once the handle to the cup has become established there is a breakaway price move. We are at the latest in a nested series and the all time price high from last December is in play again. 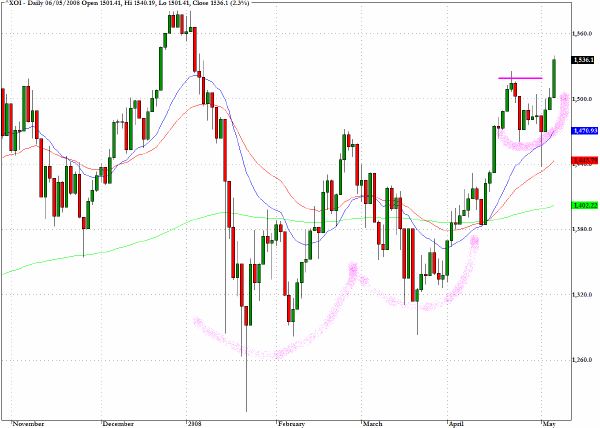
The movements and correlations within the major sectors as well as the allocation cross currents are suggesting that another struggle could be shaping up between the equity bulls and the hard asset enthusiasts.
One of the charts that I shall be watching this week is for the Brazilian index (^BVSPA) which recorded a rather portentous tiny body hanging man candlestick close to all time highs for this index near to the 70,000 level.
Also worth monitoring this week for sentiment in the emerging markets is the Shanghai Exchange (^SSEC) which closed down more than 4% in today's trading and the Hang Seng Index (^HSI) which closed out Wednesday's session with a 2.5% decline. 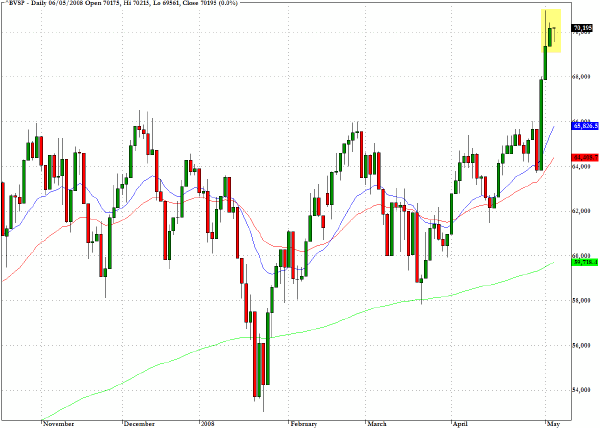
In yesterday's column I drew attention to Advanced Micro Devices (AMD) which had broken above a key downward trendline and the 50-day EMA in Monday's session. The stock provided an excellent entry opportunity on the open yesterday and at one point could have delivered a more than 15% return on the day. 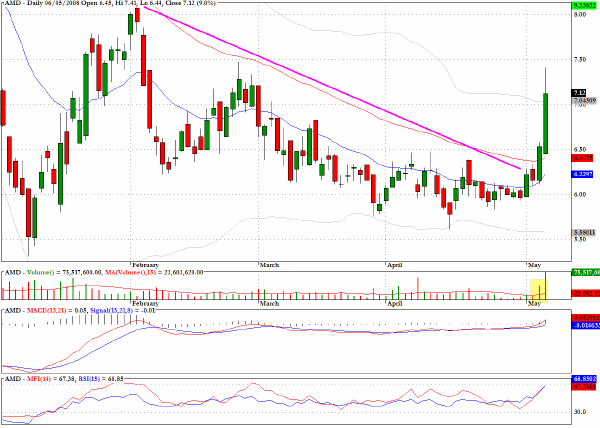
The chart for Broadcom (BRCM) is somewhat intriguing. On the face of it there is a bull flag pattern that would suggest that this stock is preparing to move higher. The only caution I have about the pattern is the hanging man candlestick that I have marked. Normally this pattern at the top of the flag pole would disqualify the pattern and I would wait for further evidence that there is further buying about to come into play. 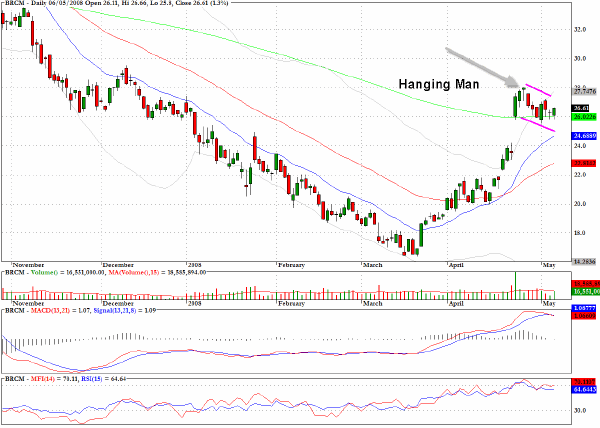
Tellabs (TLAB) should run into overhead resistance as it approaches the 50-day EMA. 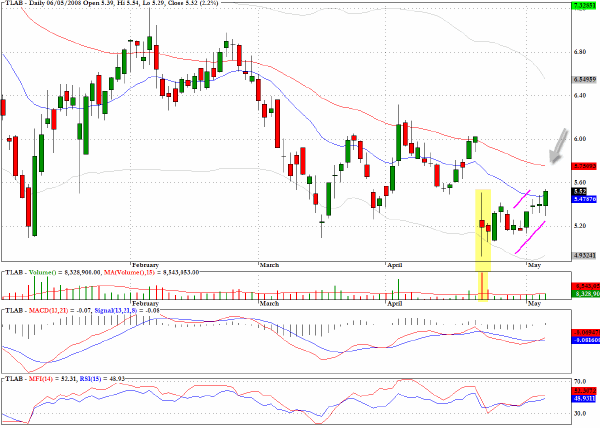
Sara Lee (SLE) broke below two moving averages yesterday, and also notable are the negative divergences on the MACD and MFI charts. 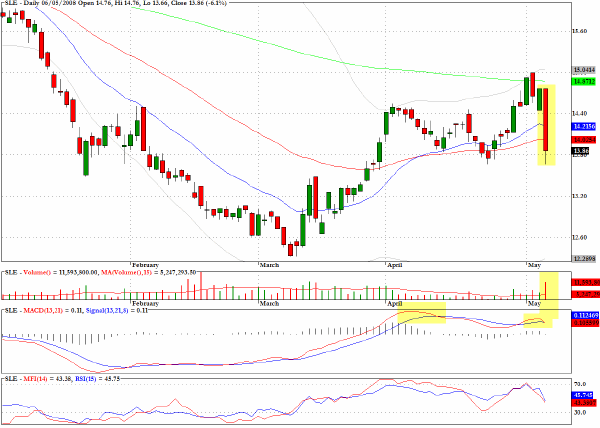
Avon Products (AVP) is showing whipsaw behavior following the recent shooting star candlestick that was registered when the stock attempted to break out of its recent trading range. 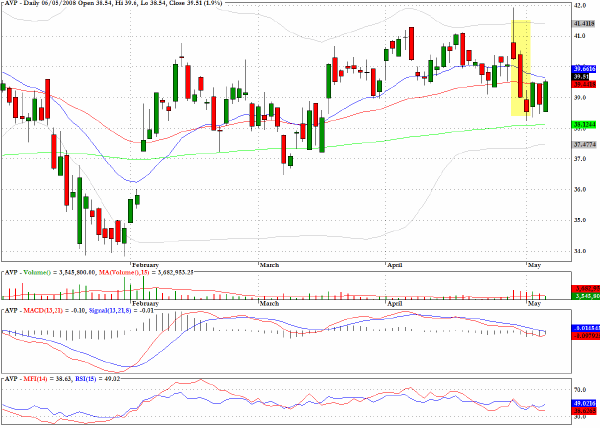
Clive Corcoran is the publisher of TradeWithForm.com, which provides daily analysis and commentary on the US stock market. He specializes in market neutral investing and and is currently working on a book about the benefits of trading with long/short strategies, which is scheduled for publication later this year.
Disclaimer
The purpose of this article is to offer you the chance to review the trading methodology, risk reduction strategies and portfolio construction techniques described at tradewithform.com. There is no guarantee that the trading strategies advocated will be profitable. Moreover, there is a risk that following these strategies will lead to loss of capital. Past results are no guarantee of future results. Trading stocks and CFD's can yield large rewards, but also has large potential risks. Trading with leverage can be especially risky. You should be fully aware of the risks of trading in the capital markets. You are strongly advised not to trade with capital.