| Corcoran Technical Trading Patterns For May 8 |
| By Clive Corcoran |
Published
05/8/2008
|
Stocks
|
Unrated
|
|
|
|
Corcoran Technical Trading Patterns For May 8
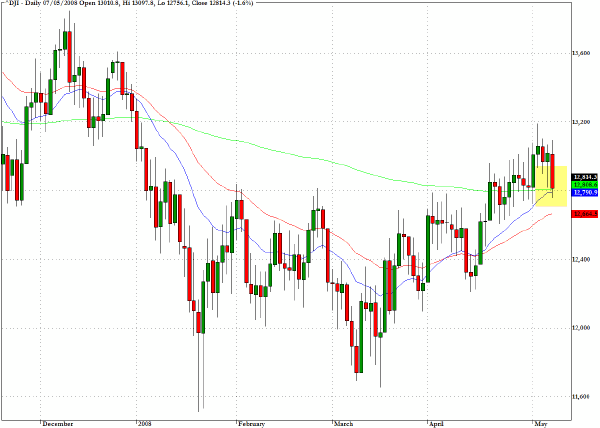
The US equity indices, many having reached upwards to areas of clear resistance, succumbed to bouts of selling in yesterday's session. There is a growing realization that the easy money may now have been made in the recovery since the March lows. While this does not persuade me to take a bearish stance it will make me more attentive to wanting to see signs that volume and money flow can more expansive during the next efforts by the bulls to take us beyond the current layers of chart resistance.
The chart for the Dow Jones Industrials (^DJI) provides a good illustration of the manner in which many indices now have to move beyond the attraction of the 200-day EMA.
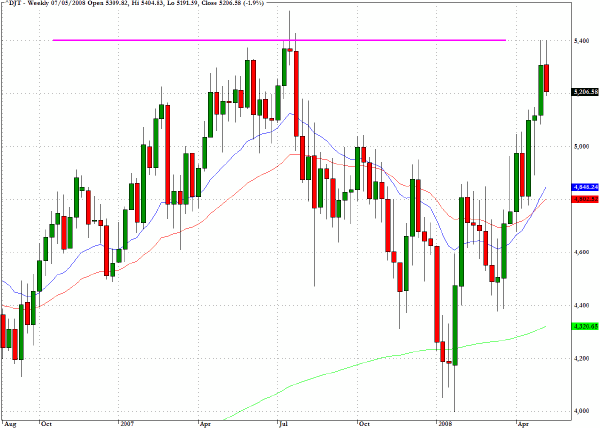
Another chart which illustrates the hurdles that need to be overcome if the rally is to make further progress is the weekly chart for the Dow Jones Transportation index (^DJT). Quietly and steadily this index has been climbing back towards the 5500 level which marks the historic high from July 2007. The index fell back 3% yesterday but the chart suggests that there is further reason to suspect that traders will maintain their efforts to challenge the previous all-time high.
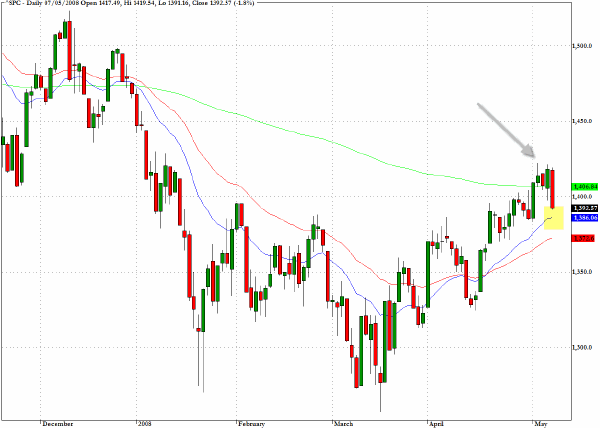
It would not be surprising for the S&P 500 (^SPC) to retreat to the 1370/1380 level which lies between the 20- and 50-day EMA's. Interestingly the 20-week EMA sits at exactly 1380.
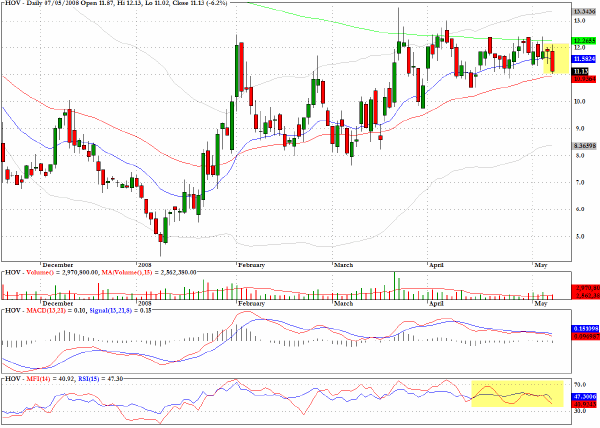
The chart for homebuilder Hovnanian Enterprises (HOV) also reveals the difficulties that many stocks are having in moving above their respective 200 day EMA's. The stock has tracked the green line which marks this moving average and is now looking, as though, at least in the near term, it is about to fail at the hurdle. The momentum has been fading and the MFI evidence suggests that institutions are not accumulating at this stage.
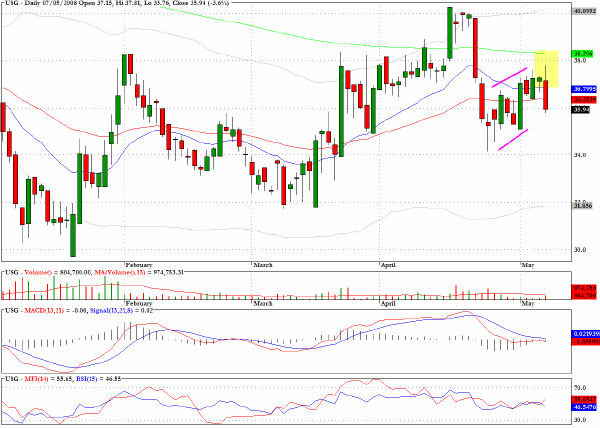
The chart for USG Corporation features a shooting star candlestick from yesterday where the upper tail almost tagged the 200 day EMA. Yet again the chart illustrates the inability of many stocks to sustain closes above this key moving average. The bearish pullback pattern and the break below two other moving averages will have me looking for an entry opportunity on the short side in coming sessions.
Clive Corcoran is the publisher of TradeWithForm.com, which provides daily analysis and commentary on the US stock market. He specializes in market neutral investing and and is currently working on a book about the benefits of trading with long/short strategies, which is scheduled for publication later this year.
Disclaimer
The purpose of this article is to offer you the chance to review the trading methodology, risk reduction strategies and portfolio construction techniques described at tradewithform.com. There is no guarantee that the trading strategies advocated will be profitable. Moreover, there is a risk that following these strategies will lead to loss of capital. Past results are no guarantee of future results. Trading stocks and CFD's can yield large rewards, but also has large potential risks. Trading with leverage can be especially risky. You should be fully aware of the risks of trading in the capital markets. You are strongly advised not to trade with capital.
|