| Corcoran Technical Trading Patterns For May 9 |
| By Clive Corcoran |
Published
05/9/2008
|
Stocks
|
Unrated
|
|
|
|
Corcoran Technical Trading Patterns For May 9
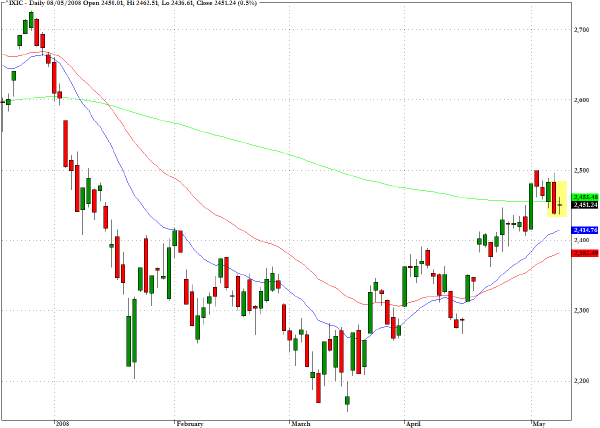
One pattern that caught my attention yesterday, and which exemplifies the current predicament faced by several of the broad indices, was seen on the Nasdaq Composite Index (^IXIC). The chart formation is quite unusual as it is both an inside pattern and a tiny doji star that was registered exactly at the 200-day EMA for this index. This formation is usually seen at inflection points and highlights the kind of directional ambiguity which can often be a precursor to a trend day movement.
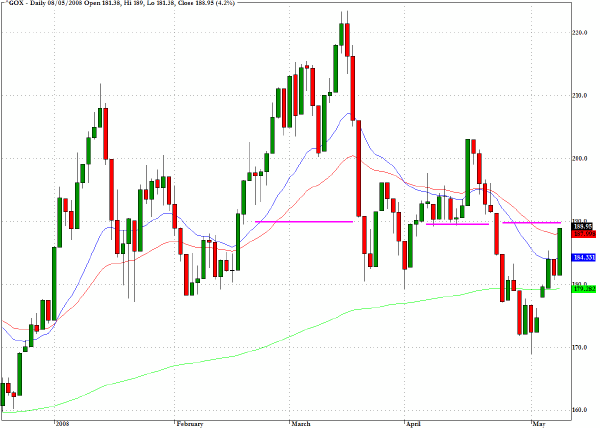
The Gold and Gold Mining Index (^GOX) has spent most of the month of May in an upswing since reaching down to the 200-day EMA. The gains have brought the index back to chart resistance and we may be close to done for this current recovery. As I suggested recently I would not be surprised to see another leg down in the precious metals ahead of a more sustained rally for the sector later in the summer.
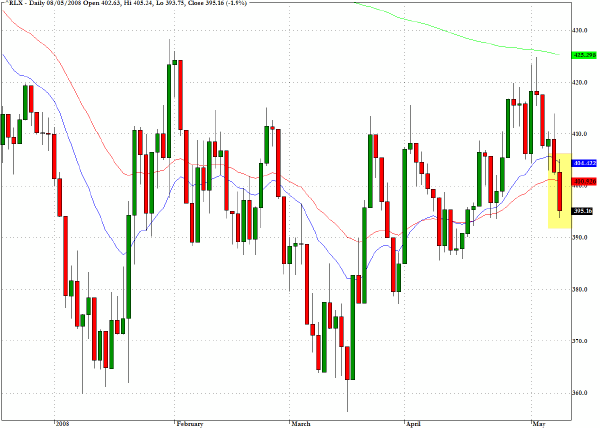
Despite some better than expected results from some retailers the S&P Retail Index (^RLX) dropped below two moving averages yesterday.
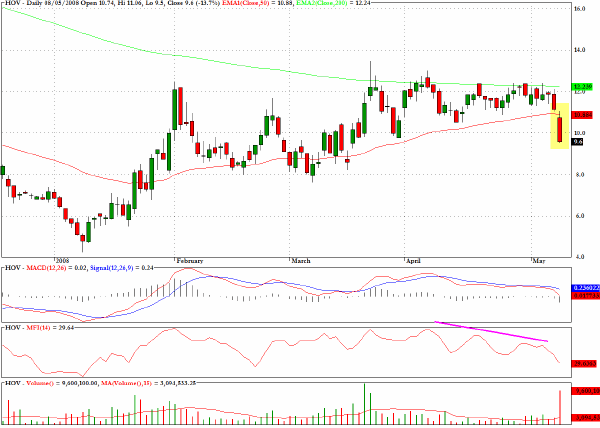
In yesterday's commentary I pointed to the bearish technical condition for Hovnanian Enterprises (HOV). One could have established a short position above the previous session's low and if done this would have delivered an almost 14% return for the day.
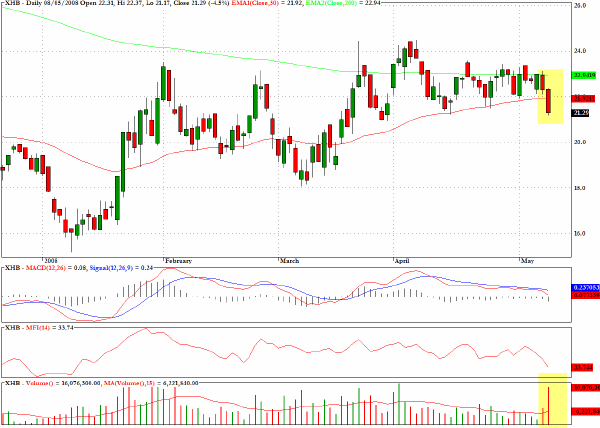
The chart pattern for the exchange traded fund for the homebuilders, XHB, has similar characteristics to the one for Hovnanian and it would appear that the mid-March low is now in play.
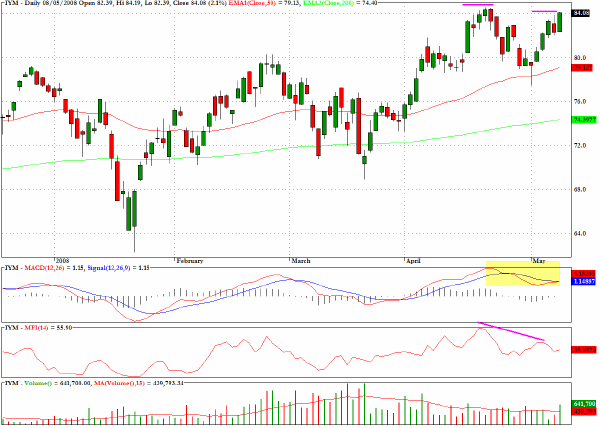
The iShares Dow Jones US Basic Materials sector fund, IYM, is revealing some quite noticeable technical divergences in association with a revisit to recent highs.
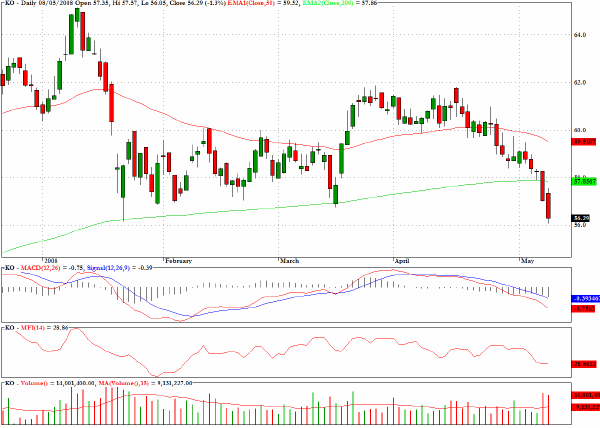
Coca Cola (KO) has continued to weaken after dropping below two key moving averages but may be reaching a potential bounce level at a new 2008 low.
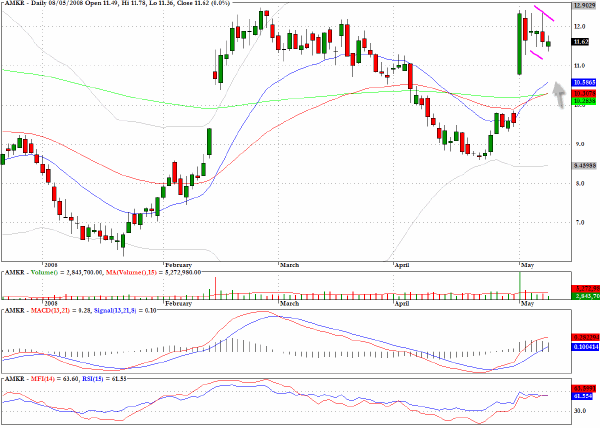
One stock that I have on the radar screen for the long side in coming days is Amkor Technology (AMKR) The evolving technical pattern qualifies as a bull flag but the pullback may have a little further to run. For those who are willing to live with looser stop loss margins the risk/reward could favor entry today on any intraday weakness.
Clive Corcoran is the publisher of TradeWithForm.com, which provides daily analysis and commentary on the US stock market. He specializes in market neutral investing and and is currently working on a book about the benefits of trading with long/short strategies, which is scheduled for publication later this year.
Disclaimer
The purpose of this article is to offer you the chance to review the trading methodology, risk reduction strategies and portfolio construction techniques described at tradewithform.com. There is no guarantee that the trading strategies advocated will be profitable. Moreover, there is a risk that following these strategies will lead to loss of capital. Past results are no guarantee of future results. Trading stocks and CFD's can yield large rewards, but also has large potential risks. Trading with leverage can be especially risky. You should be fully aware of the risks of trading in the capital markets. You are strongly advised not to trade with capital.
|