| Weekly Outlook In The Stock Market |
| By Price Headley |
Published
05/11/2008
|
Stocks
|
Unrated
|
|
|
|
Weekly Outlook In The Stock Market
NASDAQ Composite
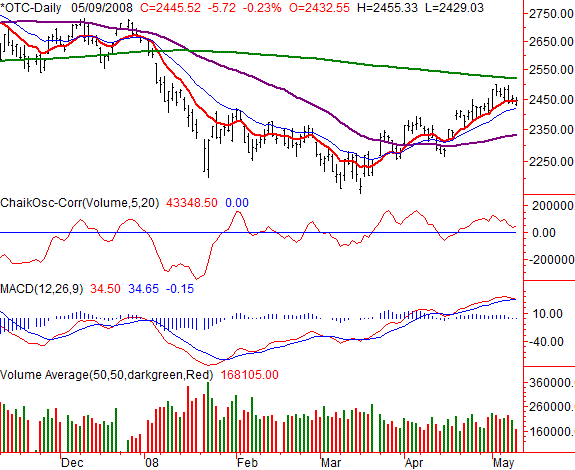
NASDAQ Composite's 5.72 point dip on Friday (-0.23%) left it at 2445.52. On a weekly basis, we saw the composite fall 31.47 points, or 1.27%. Though it still lost ground, it held up better than the other two major indices.
Think of the NASDAQ as being caught between a rock and a hard place, though those two barriers are relatively far apart. The rock is the 50-day line (purple) at 2334, and the hard place is the 200-day moving average lie (green) at 2517.
As you can see, those two lines are converging, which could squeeze the NASDAQ into a range again. In fact, it looks as if the composite slowed down as the 200-day line was approached, having never even retested it.
As a result, we're going to make a bearish MACD cross on Monday -- no matter what happens. Though volume has been weak on both sides of the table, the Chaikin lone is saying there's more bearish volume than bullish volume.
The last line of defense the bulls have on the short run is potential support at the 20-day line, it's at 2418. If it fails, a trip back to the 50-day line seems to be on tap. That said, any close above the 200-day line would be interpreted ad a buy signal.
NASDAQ Composite - Daily

S&P 500
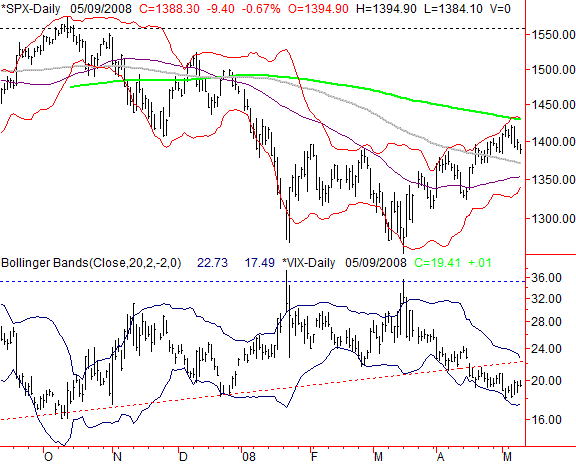
On Friday, the S&P 500 gave up 9.4 points (-0.67%) to end the day at 1388.3. For the week, the index lost 25.6 points, or 1.81%. It was the first losing week in the past four, though that fact doesn't mean we need to sound the alarm just yet.
There are actually a lot of parallels between the NASDAQ and the SPX. Namely, we say the S&P 500 fall back just shy of touching the 200-day line, yet the overall uptrend is still intact.
And like the NASDAQ, the S&P 500 has a lot of support potential from the 50-day line (purple, at 1353) and the 100-day moving average line (grey, at 1371). However, most of our attention with this chart is on the VIX.
As you see, the VIX fell under a key support line (red, dashed) in mid-April, while the market finally started to make higher highs at the same time. It was good while it lasted, but the VIX may be starting to work its way upward again. If so, that could be bearish for stocks, even if only for a few days.
Whether the VIX continues to move higher now or doesn't, either scenario actually favors the bulls eventually. How so? If the VIX resumes the downtrend, the SPX will resume its uptrend. If the VIX moves higher, it's going to find a ceiling in the upper Bollinger band at 22.73 (the VIX closed at 19.41 on Friday). The only scenario that would be bearish in the bigger picture is of the VIX doesn't find resistance at its upper band line.
Bottom line: there are more bullish scenarios here than bearish ones, even if we don't see them play out immediately.
S&P 500 - Daily

Dow Jones Industrial Average
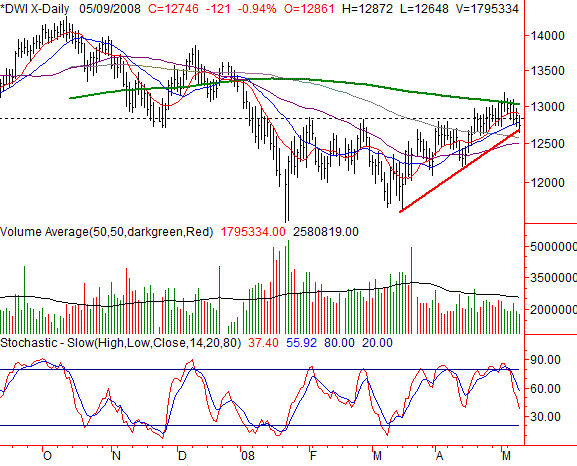
Friday's 121 point selloff for the Dow (-0.94%) was the worst result for the day among the three key indices. The same is true for the Dow's week. It closed 312 points under last week's close -- a loss of 2.39%. The Dow Industrial Average ended the week at 12746. That, however, isn't a threat to the bulls yet.
On the Dow's chart, it's not a surprise to see the pullback. We were stochastically overbought. No big deal, because we've seen it happen before in the last few weeks. The worst outcome was the Dow's revisit to an intermediate-term support line (red), which it re-met on Friday. If that support line doesn't hold, there are a couple more than could just below it.
The irony behind the Dow's week? Though it posted the worst results, it also came the closest to cracking its 200-day moving average line (and actually did for a while). Where the NASDAQ's rock and hard place were fairly well separated, the Dow's walls are quite close. We think this chart is most likely to give us the first hint of a market breakout or a meltdown.
A move above 13,000 is bullish, and a move under 12,500 is bearish. Simple enough. What about the S&P 500 and the VIX? Still important, but with this upcoming week being expiration week, the VIX may be a little skewed.
Dow Jones Industrial Average - Daily

Price Headley is the founder and chief analyst of BigTrends.com.
|