The US energy sector fund, IYE, is among the energy-related charts that are showing waning momentum.
In Friday's trading the SP 500 (^SPC) eroded further and came close on an intraday basis to a testing of the 1380 level that I discussed last Tuesday. As the chart reveals, this is quite a key level for the index - representing an area of previous price support/resistance which has a confluence with the ascending trendline through the lows since mid-March. It also lies in the neighborhood of the 50-day EMA as well, and I suspect that this level will get a thorough testing in the next few sessions. 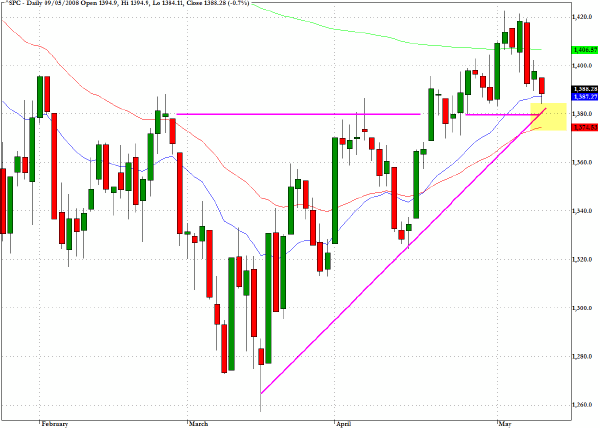
The broker/dealer index (^XBD) managed to break above a downward trendline in April but since then prices have drifted back towards the pre-breakout levels. There are two moving averages just below Friday's close for this index and I would expect to see some buying come into the sector this week. 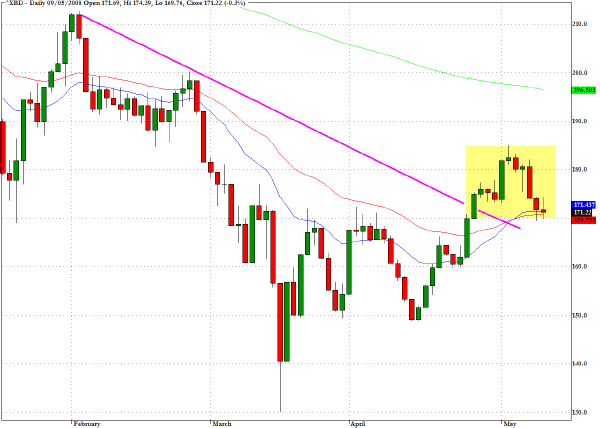
The weekly chart for the exchange traded fund UNG which tracks the price of natural gas shows that we have now penetrated the highs from about a year ago. What is less encouraging from a technical perspective is that this move to new historic levels has not been attracting a lot of volume to this ETF. 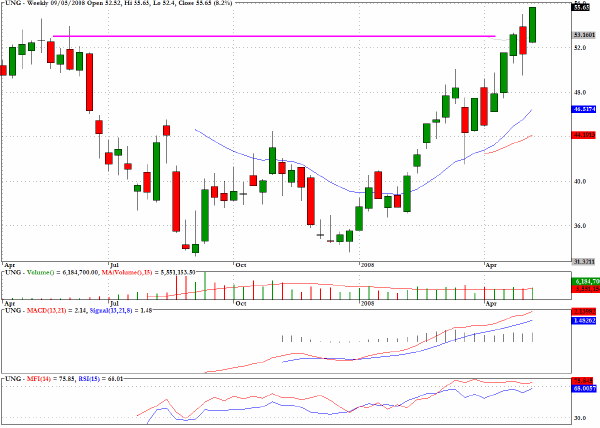
The chart for Potash of Saskatchewan (POT) shows three consecutive doji stars indicating directional indecision while the underlying technical pattern is deteriorating. One attempt to rally back towards $210 would seem to offer a viable shorting opportunity. 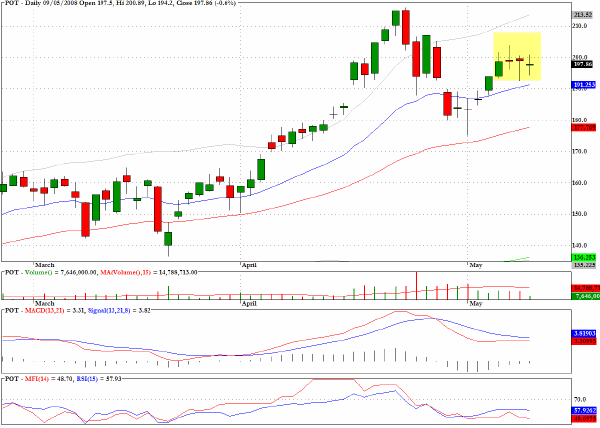
Peabody Energy (BTU) in common with several basic materials and energy related stocks is showing evidence of negative divergences as it attempts to move to new highs. 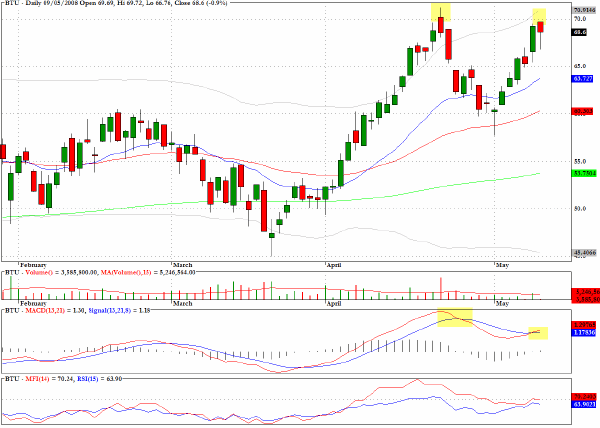
Included among the energy-related charts that are showing waning momentum is that for the US energy sector fund, IYE. 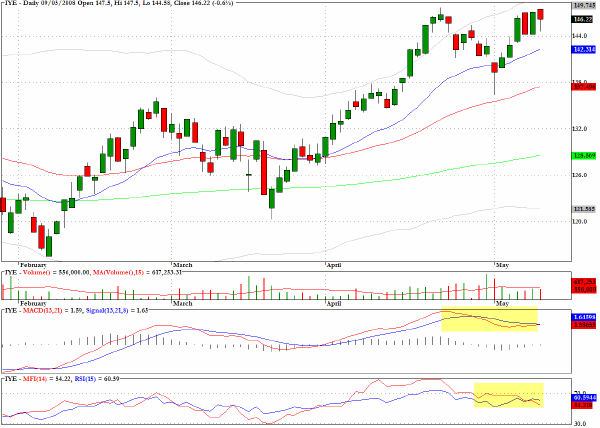
Citigroup (C) broke below two moving averages on Friday. 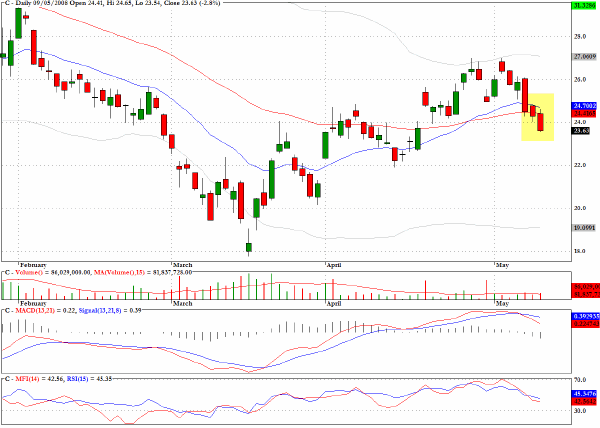
Devon Energy (DVN) illustrates why I would be very cautious about looking at the long side in the energy sector right now, and will be waiting for further evidence that a tradable correction on the short side is under way. 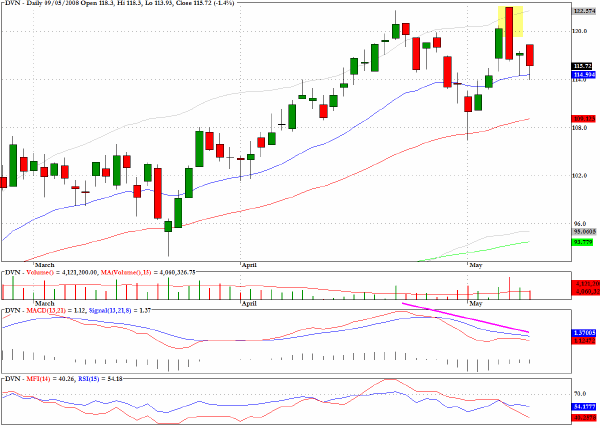
Clive Corcoran is the publisher of TradeWithForm.com, which provides daily analysis and commentary on the US stock market. He specializes in market neutral investing and and is currently working on a book about the benefits of trading with long/short strategies, which is scheduled for publication later this year.
Disclaimer
The purpose of this article is to offer you the chance to review the trading methodology, risk reduction strategies and portfolio construction techniques described at tradewithform.com. There is no guarantee that the trading strategies advocated will be profitable. Moreover, there is a risk that following these strategies will lead to loss of capital. Past results are no guarantee of future results. Trading stocks and CFD's can yield large rewards, but also has large potential risks. Trading with leverage can be especially risky. You should be fully aware of the risks of trading in the capital markets. You are strongly advised not to trade with capital.