| Corcoran Technical Trading Patterns For May 13 |
| By Clive Corcoran |
Published
05/13/2008
|
Stocks
|
Unrated
|
|
|
|
Corcoran Technical Trading Patterns For May 13
The action in the US equity market yesterday was more uniformly positive than I was expecting. We did not see a robust testing of the 1380 level on the S&P 500 that traders might have been tempted to tackle, but instead most indices made good upward progress.
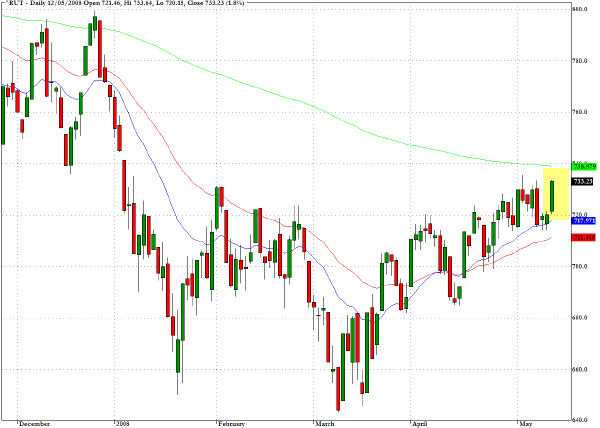
One of the better performance was seen in the Russell 2000 (^RUT) which moved up 1.8% and registered its highest close since early January. The index has to surpass the intraday high from May 2 but faces its real challenge around the 740 level which coincides with the 200-day EMA. As noted previously, it would be more reassuring for the rally continuation argument if we were to see more volume coming into the market when these key threshold levels are challenged.
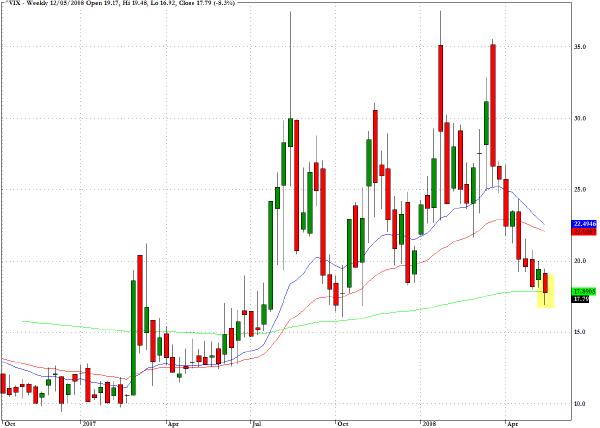
The weekly chart for the Volatility Index (^VIX) shows quite clearly how traders are continuing to set aside their concerns with market risk and the associated implied volatility which were so prevalent from the summer of 2007 to late March of 2008.
Yesterday's reading below 18 was the lowest value recorded this year and also coincides with the 200-week EMA.
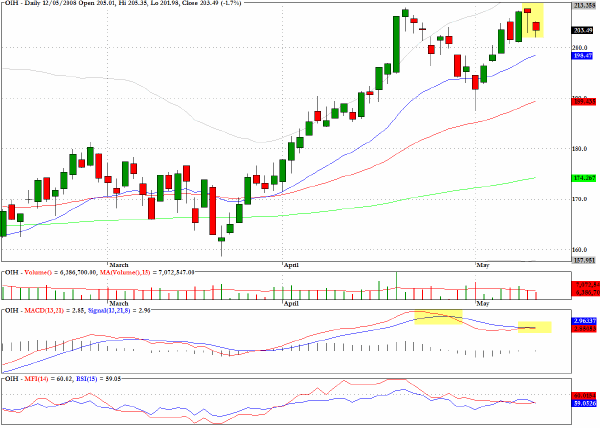
In yesterday's commentary we reviewed several energy related charts where there is evidence that the momentum is begining to wane as prices are returning to, or attaining, historically high levels. The chart for the exchange traded fund, OIH, for the oil services sector, also is showing some indications of a possible intermediate-term topping pattern.
With charts like the one below I prefer to stand aside until there is more evidence that a tradable correction is emerging.
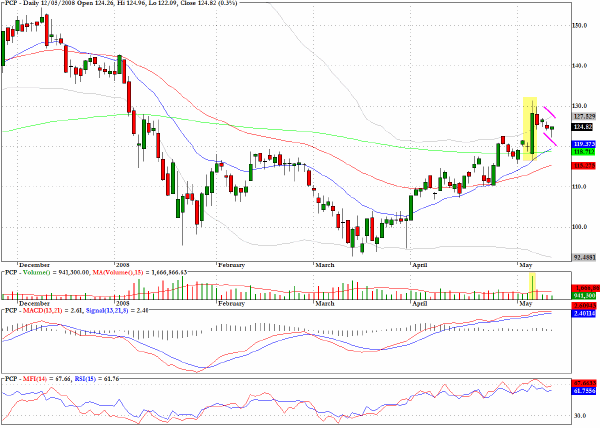
Precision Castparts (PCP) has a bullish flag pattern with the 200-day EMA likely to provide a support in the developing pullback phase.
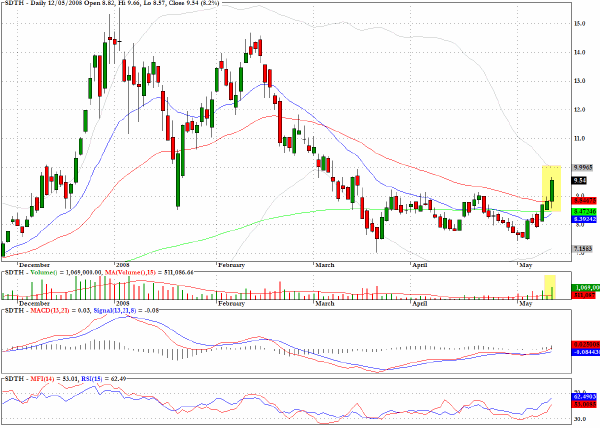
Shengda Techh (SDTH) broke away from key moving averages on heavy volume and the momentum should result in further gains.
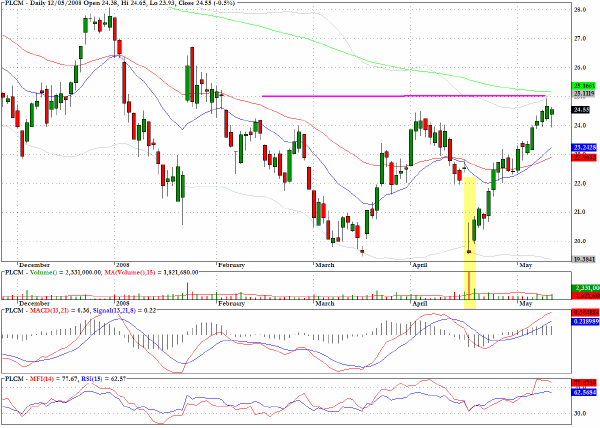
Polycom (PLCM) has moved up in a steep pullback channel since the plunge in mid-April but should now encounter strong resistance.
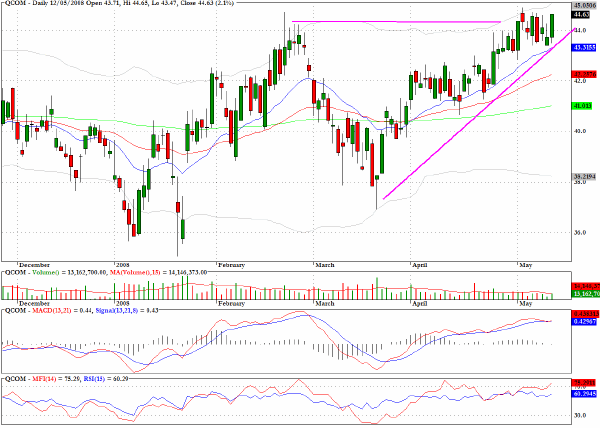
Qualcomm (QCOM) could be preparing to break out from a rising wedge pattern.
Clive Corcoran is the publisher of TradeWithForm.com, which provides daily analysis and commentary on the US stock market. He specializes in market neutral investing and and is currently working on a book about the benefits of trading with long/short strategies, which is scheduled for publication later this year.
Disclaimer
The purpose of this article is to offer you the chance to review the trading methodology, risk reduction strategies and portfolio construction techniques described at tradewithform.com. There is no guarantee that the trading strategies advocated will be profitable. Moreover, there is a risk that following these strategies will lead to loss of capital. Past results are no guarantee of future results. Trading stocks and CFD's can yield large rewards, but also has large potential risks. Trading with leverage can be especially risky. You should be fully aware of the risks of trading in the capital markets. You are strongly advised not to trade with capital.
|