| Corcoran Technical Trading Patterns For May 15 |
| By Clive Corcoran |
Published
05/15/2008
|
Stocks
|
Unrated
|
|
|
|
Corcoran Technical Trading Patterns For May 15
Some analysts and commentators spent a lot of time yesterday questioning how seriously one can take official inflation figures that appear to understate the impact to consumers from higher energy and food prices. Initially many market participants greeted the tame CPI data by rallying stocks strongly from the open, but surely one factor in the late session retreat is that, if the market is taking its discounting of the future role seriously, then we should be more concerned about the longer term inflation concerns.
Certainly the governor of the Bank of England is taking those concerns very seriously as he delivered an outlook for the UK economy that will limit both his and the government's options as growth slows and prices rise.
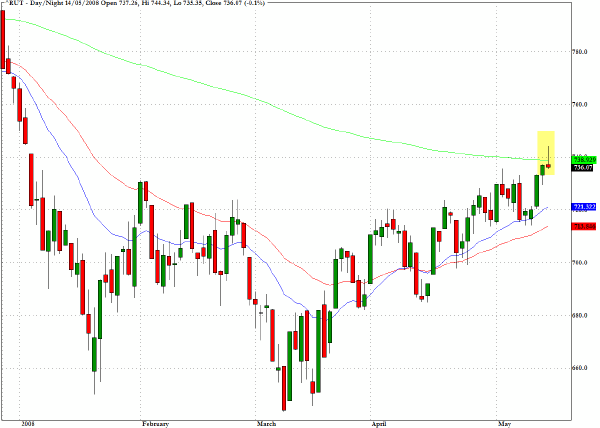
Several indices push up towards resistance levels and then retreated. The best example perhaps is provided by the Russell 2000 index (^RUT) which peeked above the 740 level, also the 200-day EMA, registered a long upper tail to the candlestick and then faded in the latter part of the session.
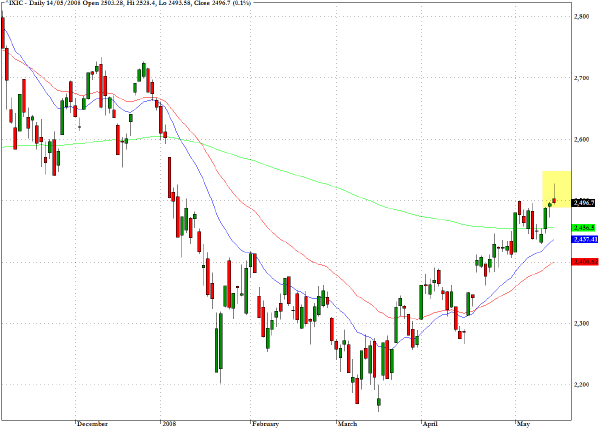
Just one more of the ubiquitous shooting star patterns seen yesterday is found on the chart for the Nasdaq Composite (^IXIC).
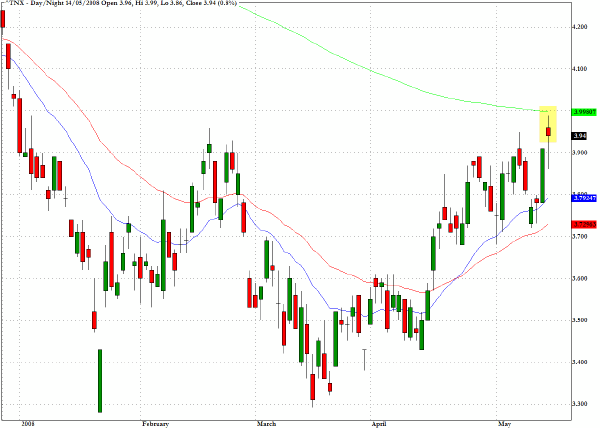
It was not only many of the equity indices that pushed up to key levels yesterday but also Treasuries. As discussed yesterday the yield on the ten year note is now set to challenge the 4% level. It approached this level yesterday despite the benign inflation data which suggests that some are many fixed income traders are not buying the notion that all is quiet on the inflation front. This candlestick shows a close near the top of the daily range in contrast to equities which almost uniformly closed near the bottom of their daily ranges.
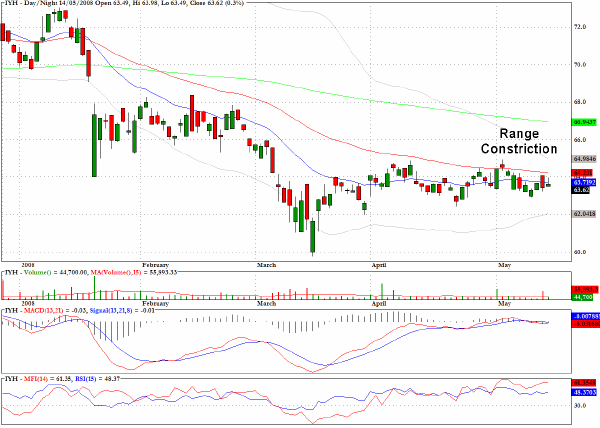
The exchange traded fund for the US health care sector, IYH, shows that price has been in a congestion pattern with range constriction. A price breakout seems imminent and in looking at some of the sector components, ABT, JNJ, LLY, PFE and AMGN it would seem that several of these stocks appear to have been sold down to levels where basing patterns are emerging.
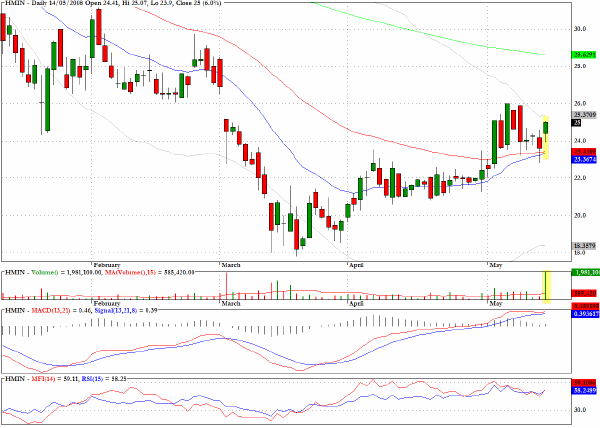
Home Inns and Hotels Management (HMIN) which showed a long tailed hammer candlestick, straddling the 50-day EMA, after Tuesday's session pushed ahead by almost six percent on a large jump in volume. The stock's upside was perhaps contained by the fading price action of the overall market in the latter part of the session.
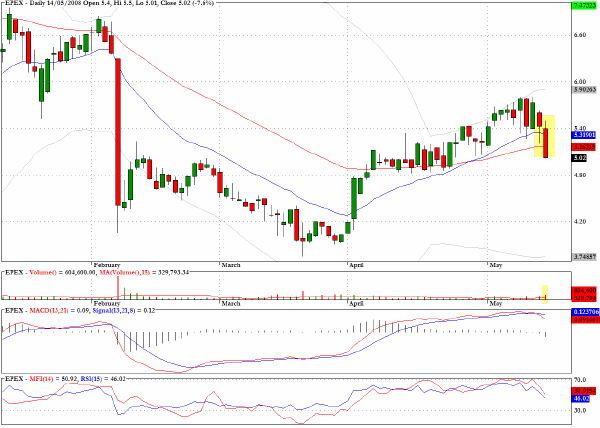
Edge Petroleum (EPEX) has fallen hard in the last two sessions and yesterday's steep drop brought the stock down below two moving averages
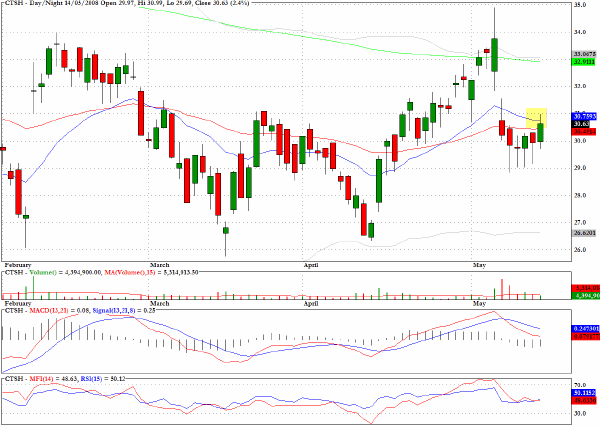
Cognizant Technology Solutions (CTSH) has an evolving bear flag pattern.
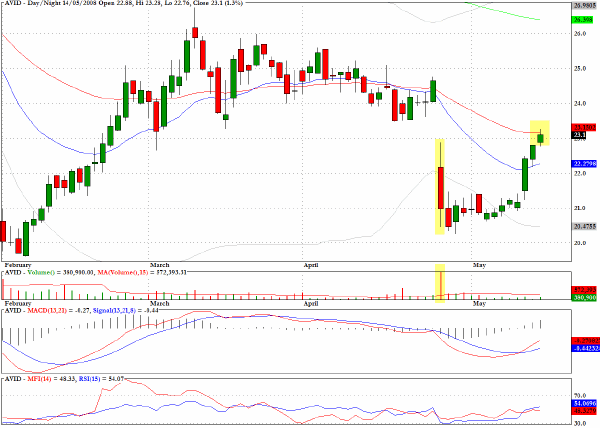
Avid Technology (AVID) has pulled back from the steep drop in late April but now has encountered chart resistance levels.
Clive Corcoran is the publisher of TradeWithForm.com, which provides daily analysis and commentary on the US stock market. He specializes in market neutral investing and and is currently working on a book about the benefits of trading with long/short strategies, which is scheduled for publication later this year.
Disclaimer
The purpose of this article is to offer you the chance to review the trading methodology, risk reduction strategies and portfolio construction techniques described at tradewithform.com. There is no guarantee that the trading strategies advocated will be profitable. Moreover, there is a risk that following these strategies will lead to loss of capital. Past results are no guarantee of future results. Trading stocks and CFD's can yield large rewards, but also has large potential risks. Trading with leverage can be especially risky. You should be fully aware of the risks of trading in the capital markets. You are strongly advised not to trade with capital.
|