NASDAQ COMMENTARY
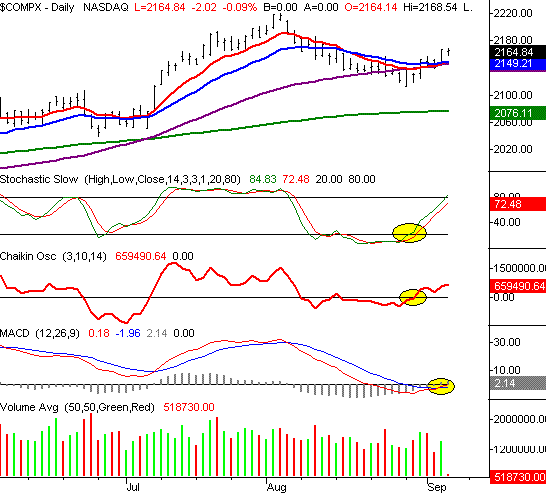
The NASDAQ is right around break-even as of right now, but as we head into the middle of the day, it doesn't look like too many traders are using yesterday's surge as a chance to lock in some gains. In fact, it looks like the composite is working to add on some more gains - it's just that a day like Tuesday's 1.2 percent rally is a tough act to follow. As of right now, the composite is at 2163.5, and right in the middle of the day's range.
But even being in the red today wouldn't change the fact that a lot of resistance was broken yesterday. After struggling at the combined 10, 20, and 50 day averages for the last month, the NASDAQ finally started to make some progress last week. Unfortunately, Thursday's and Friday's rather bearish closings hinted at a continuation of the bigger downtrend. The buyers, though, had a change of heart over the three day weekend. They came back in a good mood on Tuesday, and are hanging in there today. So even if we do close a little in the red on Wednesday, the fact that this new ground is being held should go a long way in setting a base for the next move higher.
What about the technical indicators? We should have paid closer attention to them last week...and trusted them without question. We got a stochastic buy signal last Wednesday when the second of the two lines crossed above 20, and we got a Chaikin line cross into positive territory on the same day. Now, after yesterday, we have a bullish MACD crossover. All three are highlighted below, and as far as interpreting them, we're taking them at face value - they're bullish.
From here, resistance lies at the previous high of 2220, while support should be found at the intertwined 10, 20, and 50 day lines. They're all right around 2149.
NASDAQ CHART - DAILY

S&P 500 COMMENTARY
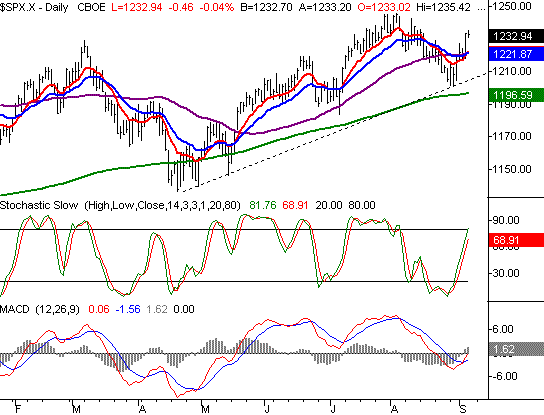
There's really not a lot to add about the S&P 500's chart. It was also struggling at the 10 day line, but rallied past several key resistance lines with yesterday's 15.4 point gain (also a 1.2 percent rise).
The SPX has made such a recovery twice before since April - once in May, and once again in July (this is something we mentioned in the Weekly Market Outlook). In both prior instances, the rally was good for about 30 points until the next peak. Extrapolating that means a move to the 1260/1265 area is possible. That's between a 2.5 and 3.0 percent gain from the current level, which would be nice for investors, and more than solid for traders.
Note that we also have two key buy signals for the S&P 500 as well - a MACD crossover, and a stochastic buy signal (we actually had them a couple of days ago).
Also note that we moved the intermediate-term support line a tad lower, to reflect last week's low of 1201.07. That, however, will be a little bit irrelevant for a while. We expect investors to get excited enough again to keep things moving this bullish direction. Just watch out for a little resistance around August's high around 1245.
Take a look at the chart of the S&P 500, BUT BE SURE to read our take on the Dow Jones Industrial Average (below) - things are getting much more interesting there.
S&P 500 CHART - DAILY

DOW JONES INDUSTRIAL AVERAGE COMMENTARY
For the most part, we'd been dogging the Dow for the last few months. It had trailed the rest of the market - in good times as well as in bad. We attribute some of that weakness to a lack of energy/oil stocks in the Dow, but even without that imbalance, these blue-chips had been floundering.
After yesterday's 142 point move, we take it all back.
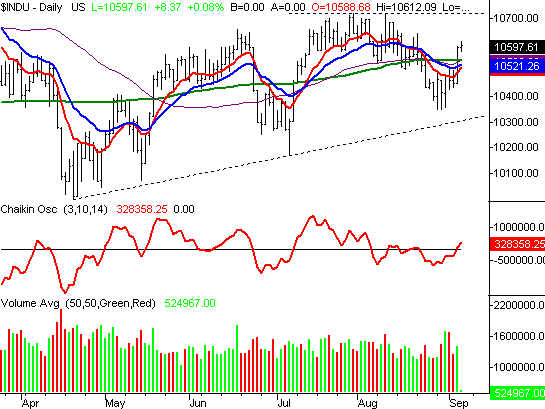
That 1.3 percent gain led stocks. And more than that, the Dow Jones Industrial Average is leading the market again today, thanks to Exxon-Mobil, Pfizer, McDonald's, J&J, Hewlett, and duPont. The Dow average itself has easily moved above yesterday's high of 10,593, reaching up to 10,612 a few moments ago. This puts the index back on top of all of its key moving averages, including the 200 day line (green) - the one that was most troubling for long-term holders.
Where did this rebound come from? It's never perfectly clear. One could make the case for a post-hurricane-rebuilding environment, but that's not quite the case - look at the stocks that are up today. The most obvious beneficiaries of the rebuilding efforts in the southeast United States are Caterpillar and Home Depot, but they're both a little stale...at best. No, the Dow's leading stocks today shows a generally aggressive tone (Pfizer, Hewlett-Packard, duPont), with some basic staples (J&J, McDonald's) thrown in for good measure. This is particularly interesting, because we'd seen this mentality persist everywhere this year except within the Dow....now it's infected these stocks too (a contagious bull trend can be a good thing).
Regardless of the reason, all three indexes are now moving in the same direction, and to the same degree. This is an indication of the general health of the overall market, as opposed to a situation where one index benefits at the expense of another.
As for signals, aside from the moving average crossover, we also got a Chaikin line crossover yesterday. Resistance is still at 10,720.
DOW JONES INDUSTRIAL AVERAGE CHART - DAILY

BOTTOM LINE
The only thing to add here is a caution - keep in mind that Tuesday's surge carried all the indexes well past their moving averages. Investors don't like a lot of 'white space' on charts, so don't be surprised to see a retest of those lines.....which means stocks could pull back a little form here. On the other hand, don't be surprised if we don't see it happen - sometimes euphoria is stronger than skepticism.
Price Headley is the founder and chief analyst of BigTrends.com.