| Weekly Outlook In The Stock Market |
| By Price Headley |
Published
05/18/2008
|
Stocks
|
Unrated
|
|
|
|
Weekly Outlook In The Stock Market
NASDAQ Composite
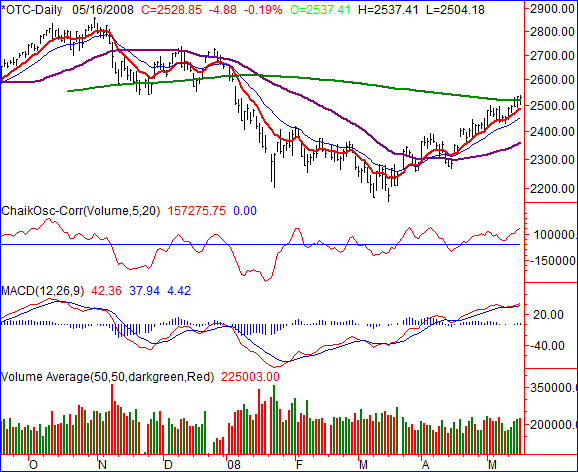
The NASDAQ's close of 2528.85 on Friday was the result of a 4.88 point/-0.19% loss. That was still 83.33 points higher than the previous Friday's close, meaning the NASDAQ was the weekly winner with its 3.41% rally. If this is a fake-out rally, it certainly is a good dupe.
Expiration week or not, the NASDAQ was the first index to get above its 200-day moving average (green) for two consecutive closes. And, the accumulation volume has been solid, if not growing. Since we have to call a spade a spade, that's bullish.
On the flipside, the unchallenged rally is also dangerous. At this point we'd be hesitant to jump on it without first verifying this was the real thing. How do we do that? Wait for a dip and see if it persists. Support at the 20-day line (blue, 2454) would mean a great deal.
NASDAQ Composite Chart - Daily

S&P 500
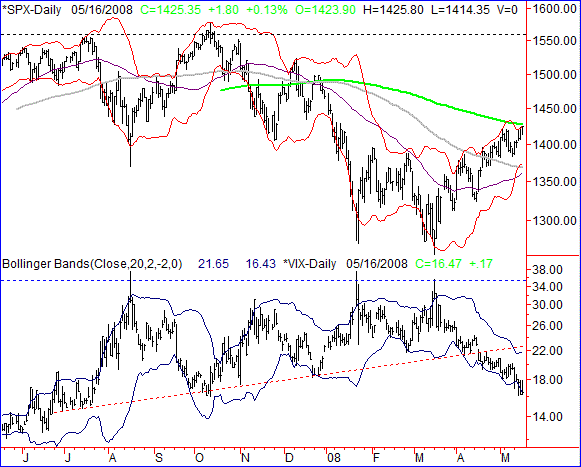
The 1.8 point gain (+0.13%) for the S&P 500 left it at 1425.35 on Friday. For the week, the SPX closed 37.05 points higher than the prior week's close, translating into a 2.67% gain. Impressive, but there's one last looming hurdle to get over before getting excited.
Though the upper 20-day Bollinger band (2 SDs) has not allowed the S&P 500 to close above it, it hasn't exactly sent it tumbling either. Each instance where it was touched led to a brief pause, and then a move to higher highs. Like we said, the real test is going to be the 200-day moving average line (green) at 1428.
The real story here is the VIX being back at multi-month lows, and still apparently headed lower. The one footnote to add and the potential trump card is that last week was expiration week, which can skew option trading volume as well as option trading prices, which is what the VIX is based on. In other words, the VIX's selloff may be artificial.
Assume nothing though. Remember, the VIX was trading below 15 for the better part of 2005, and stocks were gently rallying the whole time. This could be wildly bullish, though we still encourage waiting for a confirmation retest before jumping on board.
S&P 500 Chart - Daily

Dow Jones Industrial Average
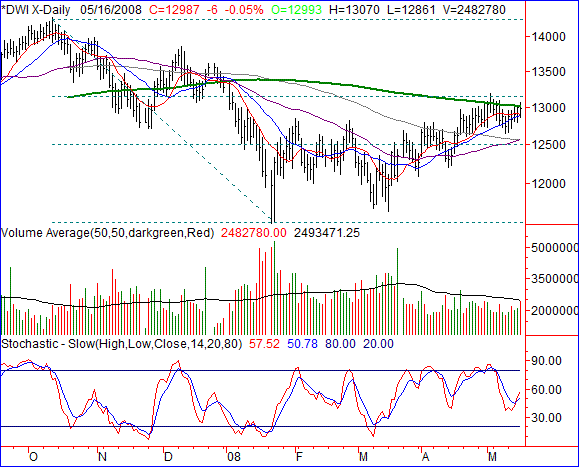
On Friday we saw the Dow Jones Industrial Average make a slight loss of 6 points, closing out at 12,987. On a weekly basis, that meant a 241 point (+1.89%) gain. Though the index ended the week in the plus column, the lower low and lower high doesn't exactly scream strength. And, the 200-day average is still a problem.
By virtue of its minimal volatility, the Dow looks least vulnerable to a pullback. That's because all the potential support areas -- the short-term moving averages -- are right below this week's bars.
Thee key here though is the 200-day line. Getting above it soon could spark a rally, as the S&P would probably do the same. Just to add a safety measure though, let's go ahead and say the line in the sand is at 13,146. That's where a key Fibonacci retracement line (dashed) is looming. If it fails to hold the Dow, the rally could take root.
By the way, expiration week or not, the Dow's selling volume has been stronger than it's buying volume the last couple of weeks, despite the gains. That's the one chink in the armor.
Dow Jones Industrial Average Chart - Daily

Price Headley is the founder and chief analyst of BigTrends.com.
|