|
What's Going On With The VIX?
The Volatility Index ($VIX) charts the volatility levels in the S&P 500. A high VIX reading indicates a market that is very uncertain and fearful. A low VIX reading indicates a market that is content and comfortable.
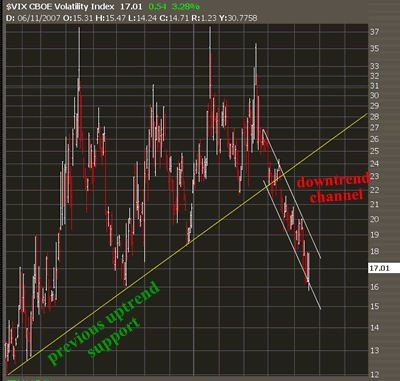
Let's take a moment to analyze the 1-year chart on the VIX. As you can see on the chart, the VIX recently broke through a solid 1-year uptrend. Since breaking the uptrend line, the VIX has created a downtrend channel causing heavy downside pressure in the indicator (bullish for the market).
Yesterday, the VIX pushed just below 16 before seeing a sharp upside reversal. I'm personally watching this downtrend channel resistance very close here. If the VIX breaks through the downtrend channel resistance (best noted on the 60-day chart), it is likely that it will see continued upside momentum. Upside momentum in the VIX would translate to downside pressure in the market. Therefore, a break of this resistance will prompt me to take on some bearish positions.

Andy Swan is co-founder and head trader for DaytradeTeam.com. To get all of Andy's day trading, swing trading, and options trading alerts in real time, subscribe to a one-week, all-inclusive trial membership to DaytradeTeam by clicking here.
|