| Corcoran Technical Trading Patterns For May 21 |
| By Clive Corcoran |
Published
05/21/2008
|
Stocks
|
Unrated
|
|
|
|
Corcoran Technical Trading Patterns For May 21
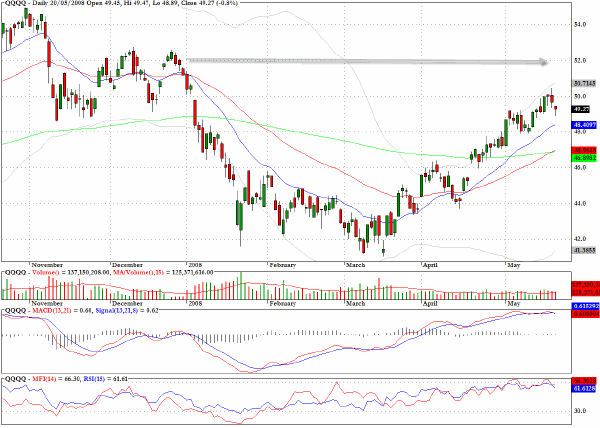
QQQQ, the exchange traded fund that tracks the Nasdaq 100, pulled back by 0.8% in yesterday's session after Monday's flirtation with the 50 level which coincides approximately with the 2000 level on the cash index. There has been a pickup in volume during the last few sessions suggesting that higher prices are beginning to attract the bears and, as I have recently commented, there is growing evidence that a corrective phase could be imminent.
Reviewing the longer time frame, the $52 level on the QQQQ fund looks like a viable target before we see a substantial correction but the fact that many traders may be interpreting the charts in a similar fashion could mean that further progress towards this level will bring out the short sellers en masse.
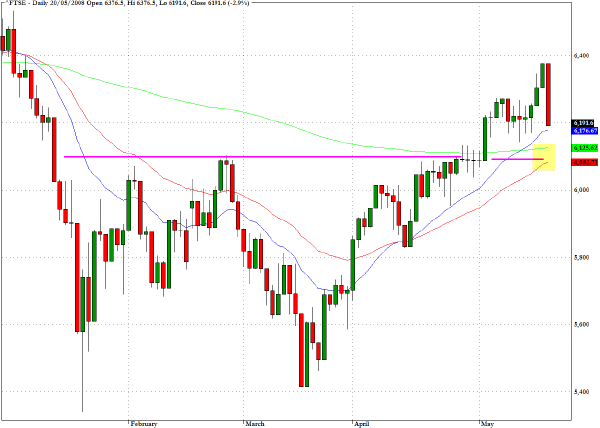
Most global markets were considerably weaker yesterday than the eventual performance seen in the US. London's FTSE tumbled by 2.9% after showing relative strength last week. There are two lines of chart support for the index below yesterday's closing level. The nearer to that close is the 200-day EMA at 6125 followed by an even more substantial one at around 6060 which also coincides with the 50-day EMA.
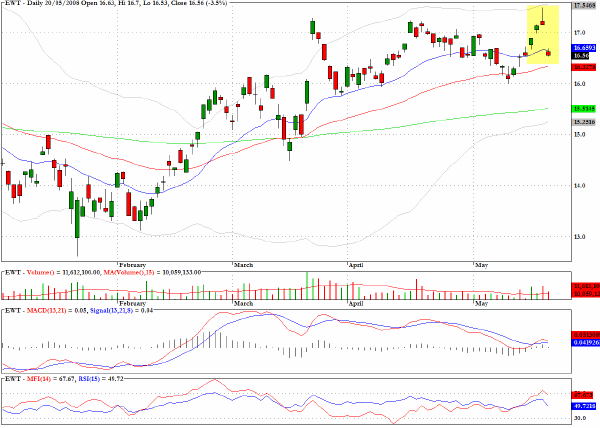
In Monday's column I commented that among the Asian sector funds "EWT which tracks the Taiwan market, could become vulnerable as it attempts to overcome last October's highs." The exchange traded fund dropped by 3.5% yesterday after registering the shooting star formation in Monday's session.
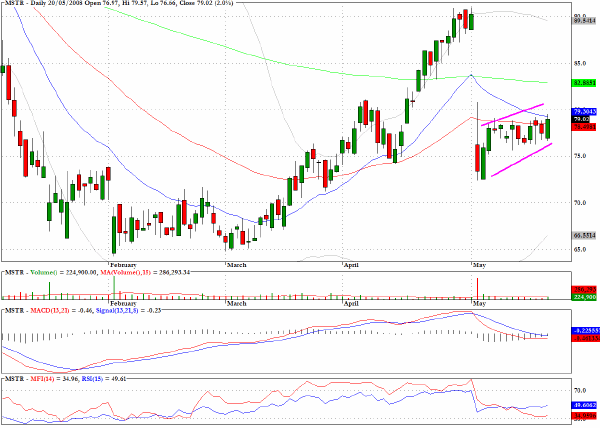
Microstrategy (MSTR) looks vulnerable as the definitive technical characteristics of a bear flag are in evidence.
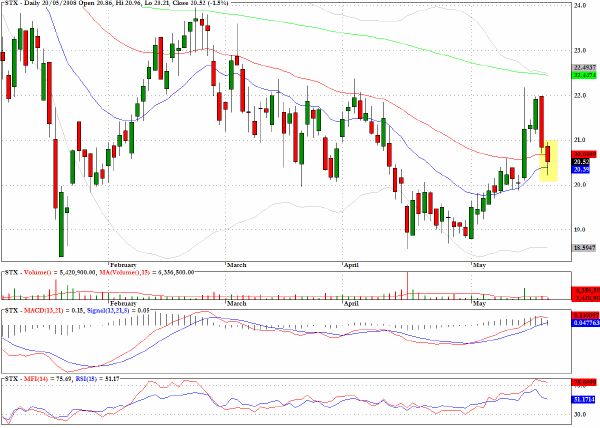
I would be looking at the long side for Seagate Technology (STX) and would expect it to challenge the 200-day EMA in coming sessions.
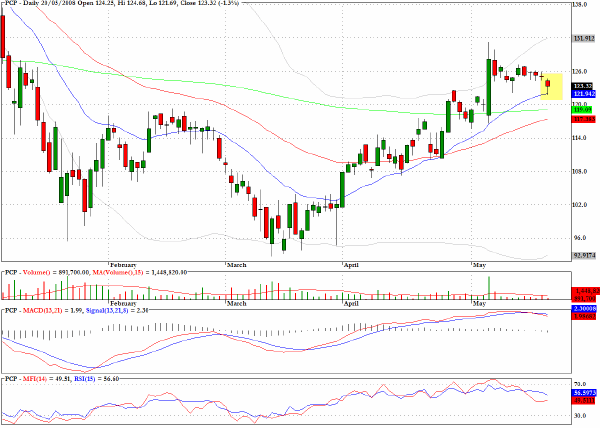
Precision Castparts (PCP) has a bullish flag pattern with the 200-day EMA likely to provide a support in the developing pullback phase.
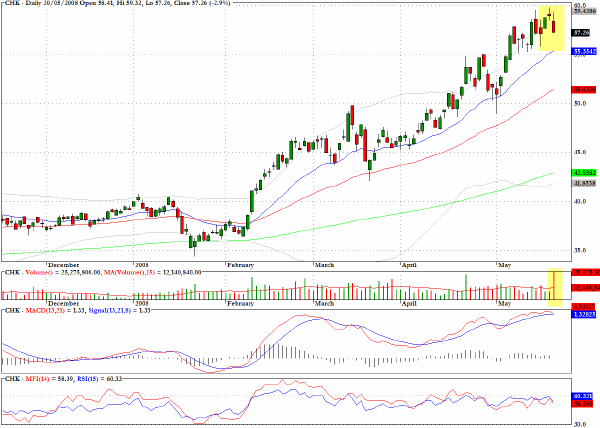
Chesapeake Energy (CHK) reveals an evening star and yesterday's drop following the star formation was on substantial volume. Just one of many energy stocks to keep on the radar for when the tide turns.
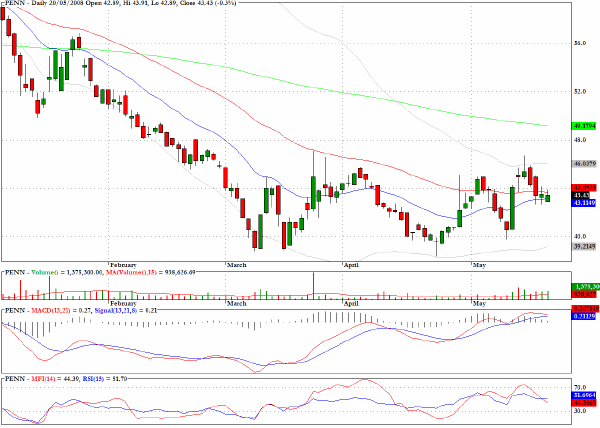
The chart for Penn National Gaming (PENN) shows a basing pattern with positive MACD divergences although the volume picture could be more compelling.
Clive Corcoran is the publisher of TradeWithForm.com, which provides daily analysis and commentary on the US stock market. He specializes in market neutral investing and and is currently working on a book about the benefits of trading with long/short strategies, which is scheduled for publication later this year.
Disclaimer
The purpose of this article is to offer you the chance to review the trading methodology, risk reduction strategies and portfolio construction techniques described at tradewithform.com. There is no guarantee that the trading strategies advocated will be profitable. Moreover, there is a risk that following these strategies will lead to loss of capital. Past results are no guarantee of future results. Trading stocks and CFD's can yield large rewards, but also has large potential risks. Trading with leverage can be especially risky. You should be fully aware of the risks of trading in the capital markets. You are strongly advised not to trade with capital.
|