| Corcoran Technical Trading Patterns For May 22 |
| By Clive Corcoran |
Published
05/22/2008
|
Stocks
|
Unrated
|
|
|
|
Corcoran Technical Trading Patterns For May 22
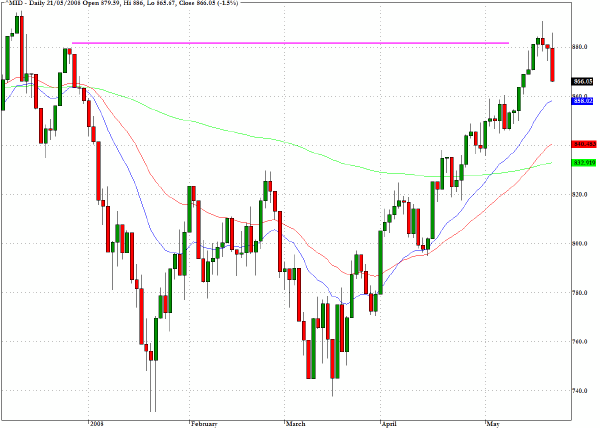
The S&P 400 Midcap index (^MID) fulfilled its target close to 880 and almost exactly on cue it has hit turbulence. The question, of course, for some fund managers who have been accumulating recently, is whether they believe that bumpy ride is going to be relatively short-lived or whether they might decide to put the buying spree that has been in evidence since late March on hold, at least for the time being.
I suspect that while some of the bargain hunters that have entered the market since late March will be happy to liquidate and retreat to the sidelines, the stance of a super accommodating Fed will encourage many fund managers to continue to nibble at equities in the belief that there is now a safety net under the market.
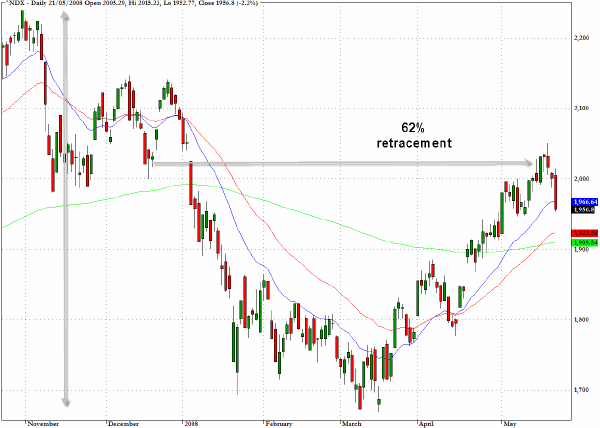
In yesterday's commentary we reviewed the exchange traded fund, QQQQ, and today I thought we should look at the underlying Nasdaq 100 index (^NDX).
On the cash index the intraday high that was touched in Monday's session, just above 2050 coincides almost perfectly with the 62% retracement of the interval between the late October high on the index and the March 10 low at 1672. We could retreat back to the 200-day moving average level around 1900 but as I suggested in the discussion on QQQQ yesterday it does seem likely that the area around 2100 on this index which became an actively traded price zone throughout December 2007 will be targeted again.
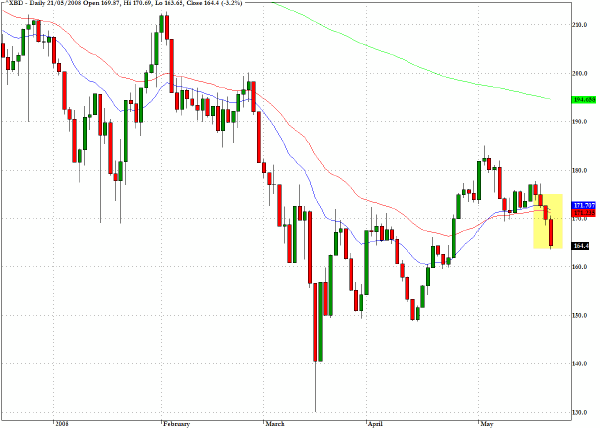
The broker/dealer sector (^XBD) has been behaving poorly recently with persistent attrition in stocks such as Goldman Sachs (GS) and Lehman Brothers (LEH)
The sector index dropped below the 50-day EMA yesterday as did Lehman and Goldman and as suggested below there is an ETF that would allow one to be short the sector
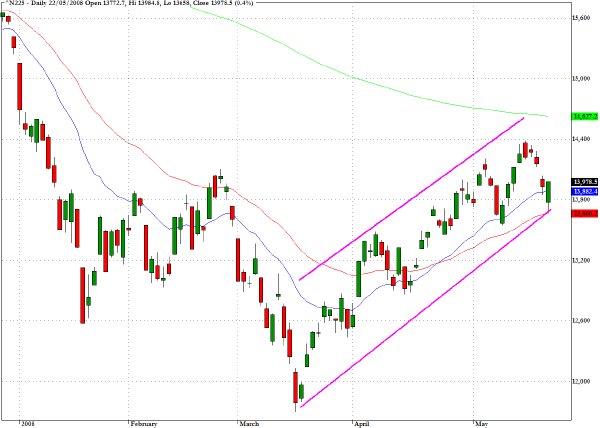
In overnight trading the Hang Seng (^HSI) fell back 1.6% after rallying in Wednesday's session but the Nikkei 225 (^N225) in Japan managed to register a small gain. The divergent behavior, especially with the Japanese market not swooning in the face of the drop in New York yesterday and $135 a barrel crude must be seen as a positive for the Nikkei. As the chart below shows, the index has, from a technical perspective, been well behaved since the turning point in March and even during this recent pullback seems to have preserved the uptrend line and not violated the 50-day EMA. However, due to its under-performance last year the index still has to challenge its 200-day moving average.
I would keep an eye on this index over coming weeks to see how it performs in relation to its 200-day EMA, and perhaps even see the success or failure to penetrate and remain above this level as a barometer of global fund manager sentiment.
The sector fund for the US brokers/dealers, IAI, reveals weak technicals and would provide short exposure to the investment banks without having to be exposed to any individual company risk.
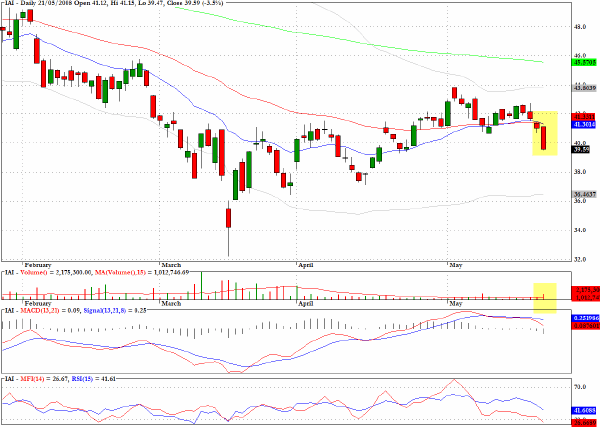
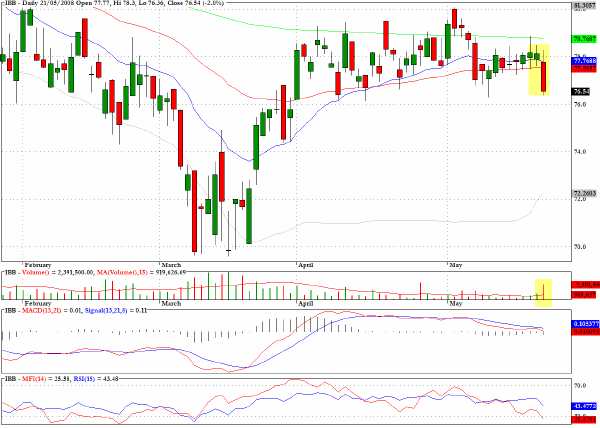
The iShares fund for the biotech sector shows a clear failure pattern to break above overhead resistance. The drop below all three moving averages yesterday was also accompanied by an uptick in volume.
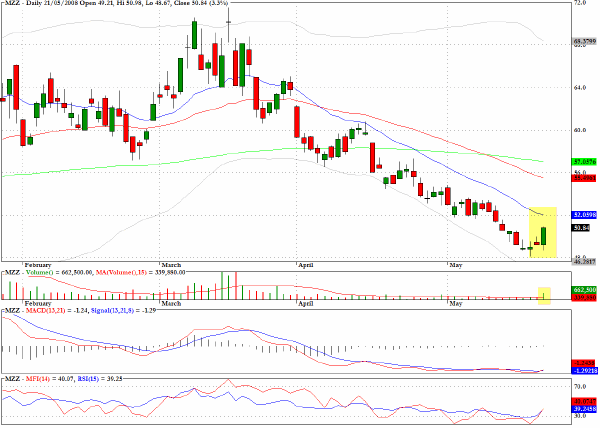
In my weekend analysis I discussed how the inverse leveraged fund MZZ provided an attractive trading opportunity to exploit the almost obvious vulnerability on the S&P 400 Midcap index discussed above. The fund gained 3.3% yesterday and could have further to go while the correction endures.
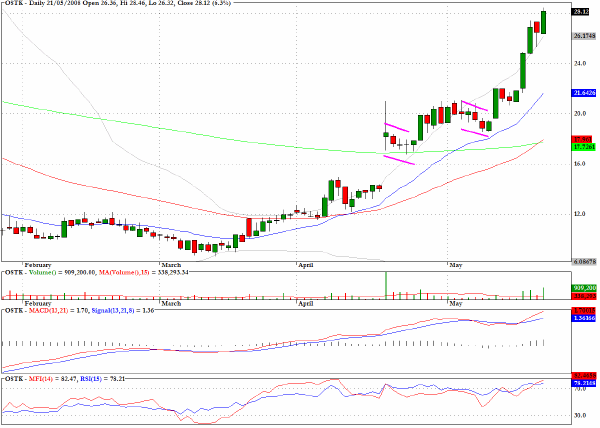
Overstock.com (OSTK)continues to outperform the market as discussed in my weekend commentary.
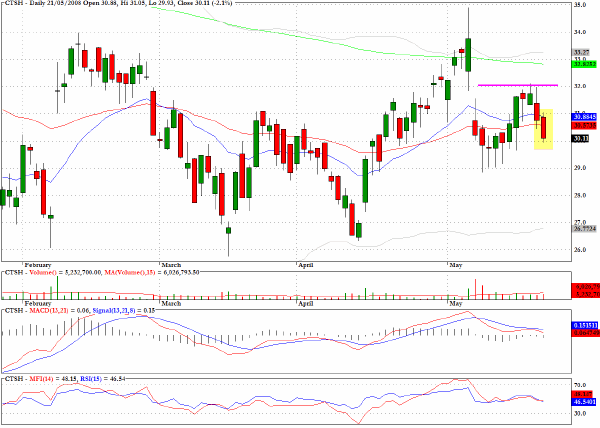
Cognizant Technology Solutions (CTSH) hit resistance at $32 and the preceding bear flag pattern suggests that there could be further scope on the downside.
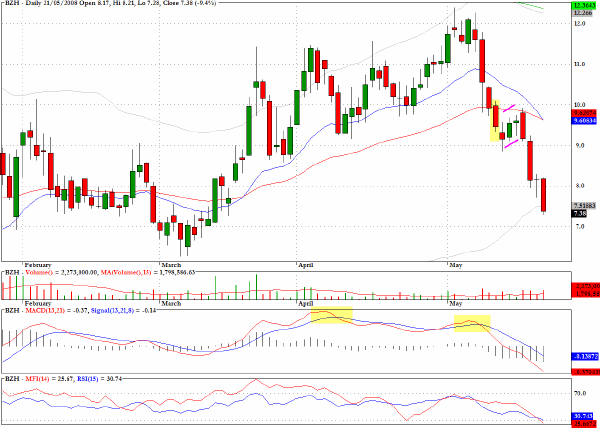
Some bearish patterns are more easily discernible than others, and the chart pattern for Beazer Homes (BZH) has been sending a clear message that the rally in late April was suspect. Moreover the initial drop below moving average support highlighted on the chart, followed by a mini pullback pattern, was also unsustainable. At this point the easy money has been made on the short side as buyers may be tempted back in as the stock approaches the March lows again.
Clive Corcoran is the publisher of TradeWithForm.com, which provides daily analysis and commentary on the US stock market. He specializes in market neutral investing and and is currently working on a book about the benefits of trading with long/short strategies, which is scheduled for publication later this year.
Disclaimer
The purpose of this article is to offer you the chance to review the trading methodology, risk reduction strategies and portfolio construction techniques described at tradewithform.com. There is no guarantee that the trading strategies advocated will be profitable. Moreover, there is a risk that following these strategies will lead to loss of capital. Past results are no guarantee of future results. Trading stocks and CFD's can yield large rewards, but also has large potential risks. Trading with leverage can be especially risky. You should be fully aware of the risks of trading in the capital markets. You are strongly advised not to trade with capital.
|