Tellabs (TLAB) ran into overhead resistance as it approached its 50-day EMA, and a typical bearish pullback pattern seems to be ready to give way on the downside.
The chart formations on several indices that resulted from Friday's downbeat session paint a mixed picture for the US market. The index which is causing the most concern is the S&P 500 (^SPC) which closed last week at what on the surface appears to be a troublesome level. The close was below the 50-day EMA, below the uptrend through the lows since mid-March and also dangerously low to the rather critical 1375 level which represents an area of previous chart support.
Should we assume that it is unequivocally the end of the rally off the Bear Stearns lows? I always prefer to take charts at face value when the volume characteristics are telling a compelling story, but this was not the case on Friday with the relatively modest pre-holiday volume. Today we could find that the pattern will attract the more zealous bears who will to try to mount a more decisive breakdown, but we could also see that their enthusiasm will get them ensnared in what could become a well orchestrated trap move by the bulls who have retreated from the fray over the last few sessions.
The week ahead should provide the directional clues we need to know whether the March lows could once again be in play. 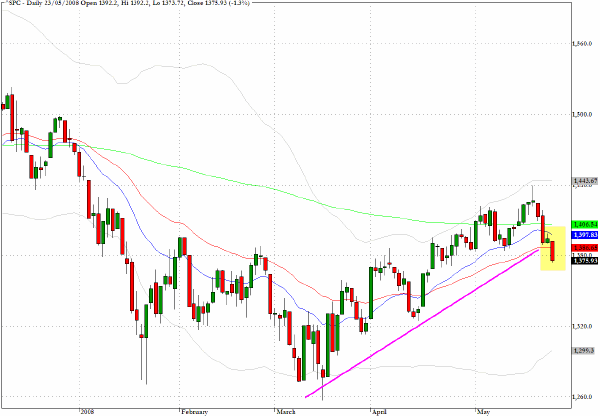
The midcap index (^MID) which was in the vanguard of the rally since mid-March met the price rejection at the 880 level that I was expecting but overall the technical patterns for the index appear a lot less problematic than those discussed on the larger cap S&P index. 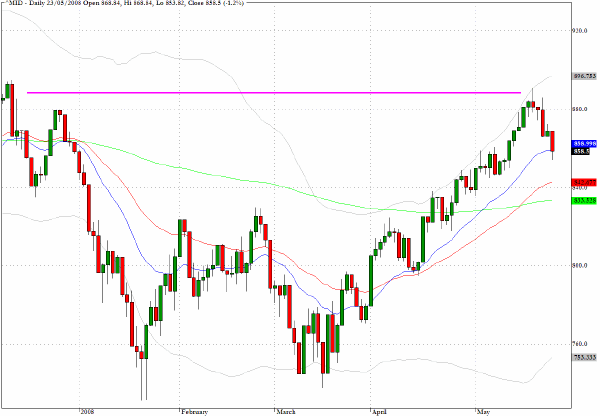
The chart below is somewhat uncharacteristic for this commentary and I will be discussing it in much greater detail during a live webinar on Wednesday courtesy of the International Securities Exchange. The topic of the presentation is The Carry Trade, Leverage and Overall Market Liquidity and will cover the close relationship between certain cross rates in the forex market and the behavior of global equity indices.
The chart below shows the very close relationship between the movements in the Australian dollar-Japanese Yen cross rate and the movements in the S&P 500 during 2007 and until present. The values for both the cross rate and the index have been normalized to allow the scales of the two variables to be matched. What is clearly in evidence is the extraordinarily close symmetry between the major peaks and troughs between the two asset classes during the period. In a nutshell this provides unusual insight into the kinds of activities that global macro hedge funds and large proprietary trading desks engage in. Not so obviously evident is the recent de-levering taking place in the financial system that this chart is pointing to. Fur further discussion of this subject please visit the ISE website and follow the links on how to register for the webinar. 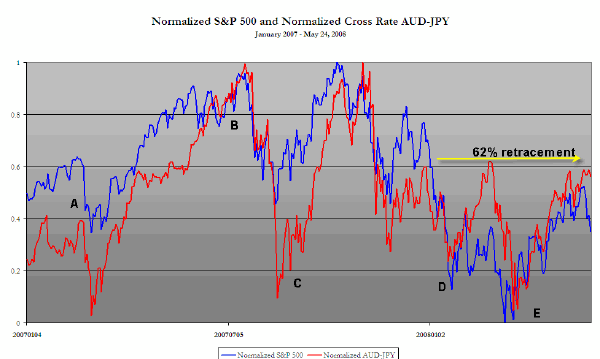
The KBW Banking Index (^BKX) is approaching levels where there is an expectation of triple bottom pattern emerging. One factor that would make me more decidedly bearish in the intermediate term is to find that the appetite for the banks from "bargain hunters" has evaporated. 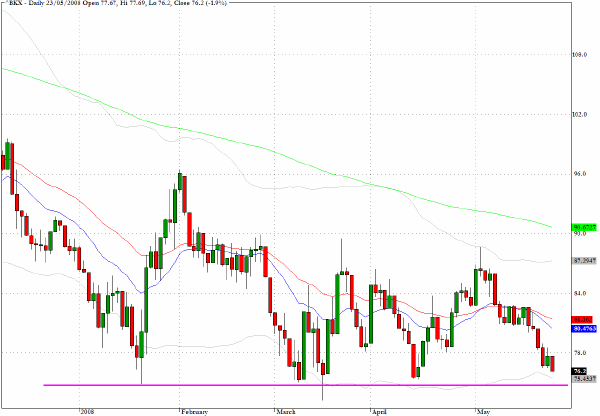
I still like the long side for Amazon.com (AMZN). 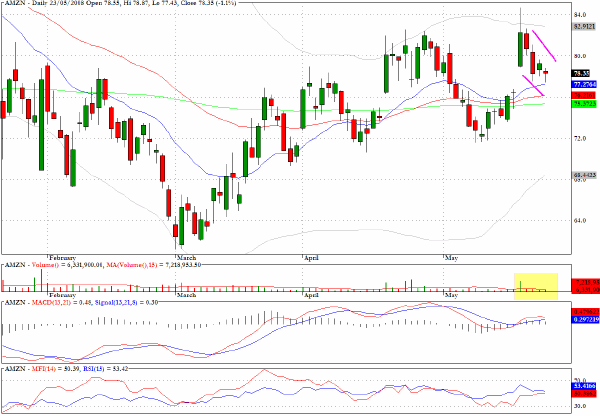
Tellabs (TLAB) ran into overhead resistance as it approached its 50-day EMA and a typical bearish pullback pattern seems to be ready to give way on the downside. 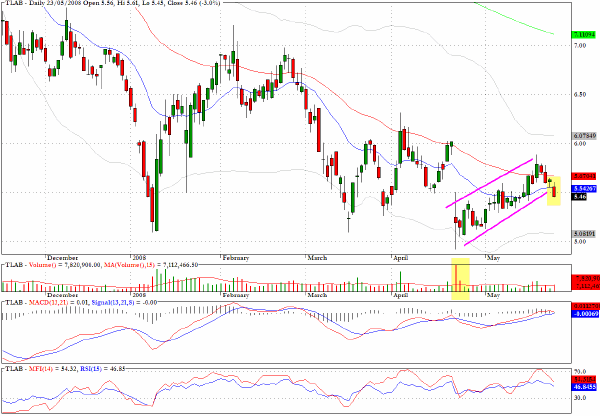
United Technologies (UTX) appears to be in a no man's land with no obvious nearby support levels to arrest the decline. 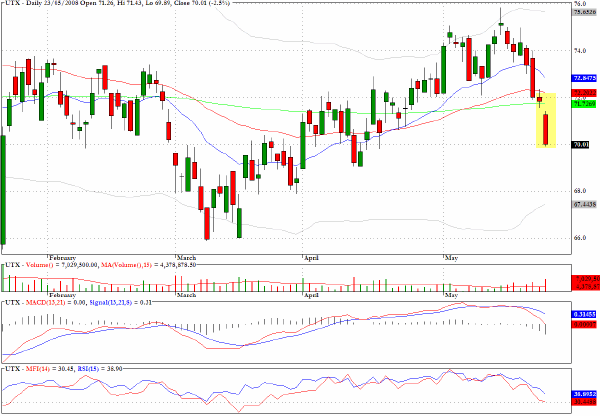
Automatic Data Processing (ADP), which had just broken below key moving averages when discussed on Friday morning, continues to reveal a weakening technical condition. 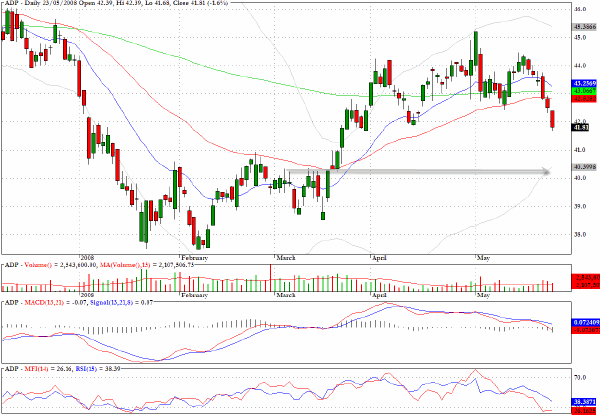
Clive Corcoran is the publisher of TradeWithForm.com, which provides daily analysis and commentary on the US stock market. He specializes in market neutral investing and and is currently working on a book about the benefits of trading with long/short strategies, which is scheduled for publication later this year.
Disclaimer
The purpose of this article is to offer you the chance to review the trading methodology, risk reduction strategies and portfolio construction techniques described at tradewithform.com. There is no guarantee that the trading strategies advocated will be profitable. Moreover, there is a risk that following these strategies will lead to loss of capital. Past results are no guarantee of future results. Trading stocks and CFD's can yield large rewards, but also has large potential risks. Trading with leverage can be especially risky. You should be fully aware of the risks of trading in the capital markets. You are strongly advised not to trade with capital.