| Corcoran Technical Trading Patterns For May 28 |
| By Clive Corcoran |
Published
05/28/2008
|
Stocks
|
Unrated
|
|
|
|
Corcoran Technical Trading Patterns For May 28
Considering some of the bleak economic news yesterday, US equities performed relatively well and regained some composure following last week's selling. This was perhaps more impressive against the backdrop of the rather problematic chart patterns that we touched on in yesterday's column. I also indicated in yesterday's column that despite concerns about the technical pattern on the S&P 500 chart, there were several others such as the S&P 400 Midcap and the Nasdaq 100 where the patterns were less ominous.
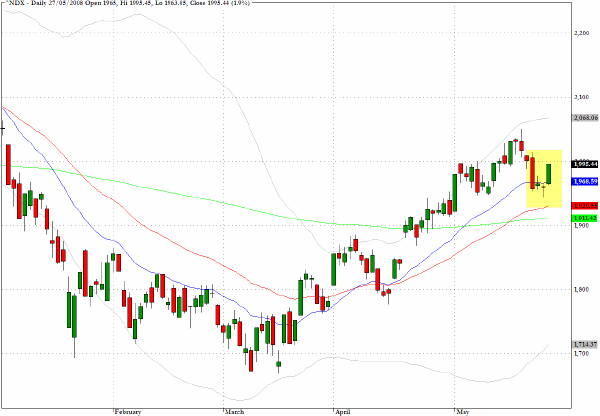
The Nasdaq 100 (^NDX) rallied ahead of the pack yesterday and recorded an almost 2% gain on the session. The four-day reversal pattern that has been highlighted on the chart could well have been reassuring to fund managers that have been loading up on tech stocks but I suspect that this index will have to show continuing leadership if the bulls are to retain the upper hand during this period of conflicting and often dire economic data.
I will be the guest presenter at a live webinar on Wednesday May 28, 2008, courtesy of the International Securities Exchange in Chicago. The topic of the presentation is The Carry Trade, Leverage and Capital Markets Liquidity and will cover the close relationship between certain cross rates in the forex market and the behavior of global equity indices.
The event takes place at 3pm EDT.
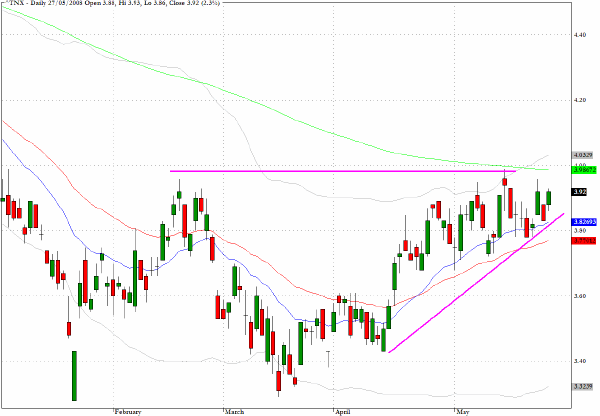
The pattern on the chart for the yield on the ten-year Treasury note shows a growing appetite by traders to take on the challenge of the 4% yield level.
Amidst all of the cross currents and debate about inflation versus deflation there is the rather pivotal issue of whether this benchmark yield can sustain closes above the 4% level. The resolution of this matter will be a key barometer as to how the market is discounting the longer term economic outlook.
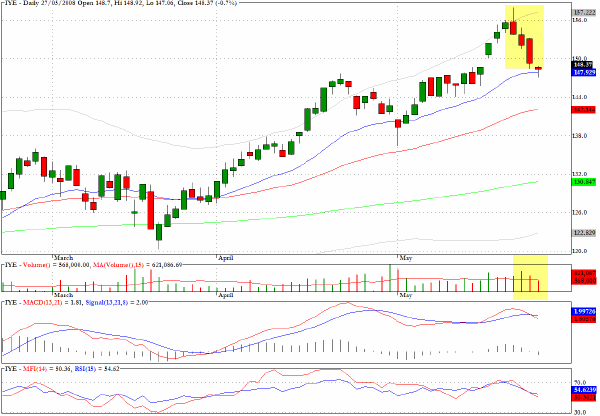
The chart for the exchange traded energy fund, IYE, which tracks the Dow Jones US Energy Index, is showing a pickup in volume that could reflect the bearish bet being made by some traders who are expecting a rolling top pattern to emerge.
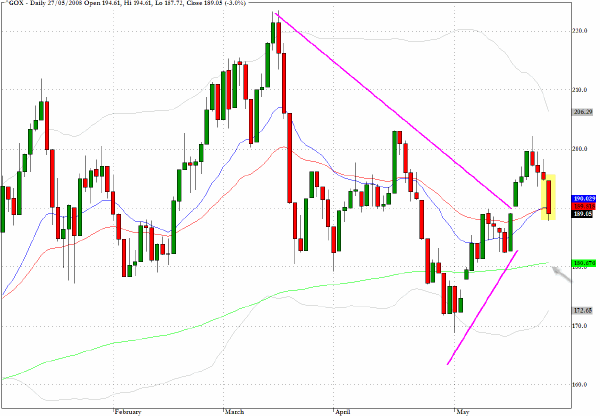
The gold index (^GOX) dropped back fairly sharply yesterday and dropped below two key moving averages. I have similar reservations as to how severe this technically weak pattern might be, as I did in relation to the chart for the S&P 500 after last Friday's close. What is apparent on the chart is the "false" breakout from the triangular pattern highlighted. For those long the precious metal and the mining shares a successful test of the 200-day EMA will be critical.
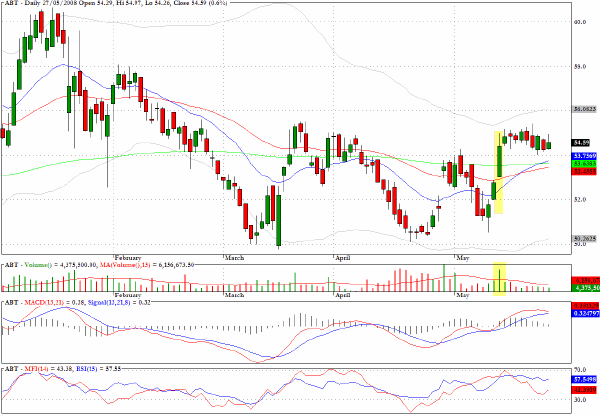
Abbot Labs (ABT) looks promising on the long side.
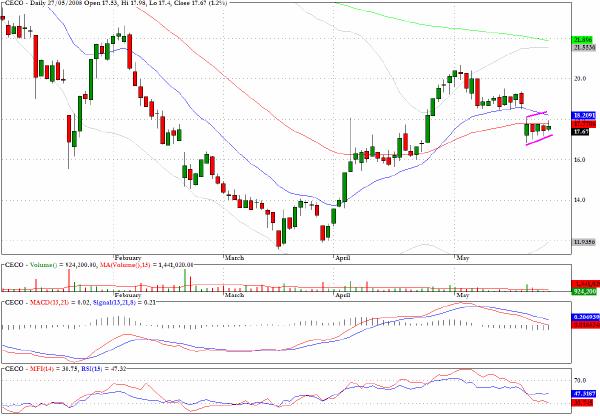
Career Education Corp (CECO) has mini bear flag and waning momentum and money flow.
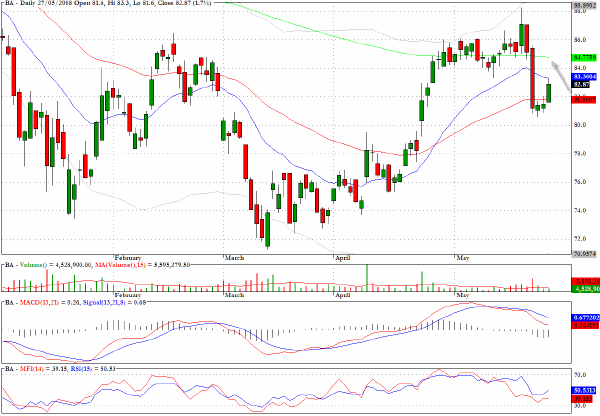
I suspect that Boeing (BA) could encounter further weakness as it tries to make it back above $85.
Clive Corcoran is the publisher of TradeWithForm.com, which provides daily analysis and commentary on the US stock market. He specializes in market neutral investing and and is currently working on a book about the benefits of trading with long/short strategies, which is scheduled for publication later this year.
Disclaimer
The purpose of this article is to offer you the chance to review the trading methodology, risk reduction strategies and portfolio construction techniques described at tradewithform.com. There is no guarantee that the trading strategies advocated will be profitable. Moreover, there is a risk that following these strategies will lead to loss of capital. Past results are no guarantee of future results. Trading stocks and CFD's can yield large rewards, but also has large potential risks. Trading with leverage can be especially risky. You should be fully aware of the risks of trading in the capital markets. You are strongly advised not to trade with capital.
|