| The McMillan Options Strategist Weekly |
| By Lawrence G. McMillan |
Published
05/30/2008
|
Options
|
Unrated
|
|
|
|
The McMillan Options Strategist Weekly
After breaking down last week and generating sell signals on most of our indicators, the market has rallied all week this week. This week's rally -- built on several diverse factors such as a declining oil price, month end window dressing, and dollar rally -- has, somewhat surprisingly, not been able to budge the technical indicators from their bearish stance.
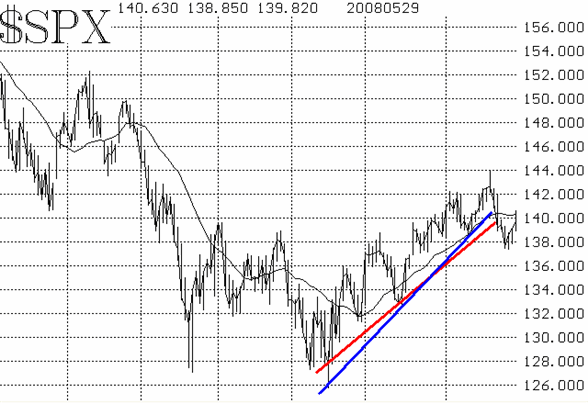
The $SPX chart took on a negative tone with the breaking of the bullish trend line that had dated back to the March bottom. Also, the 20-day moving average rolled over and began trending downward. Even though the market has rallied this week (for 3 days), it has not yet overcome that moving average. In a broader sense, the May highs (near 1425) and the May lows (near 1375) are the two important levels to watch. A bullish close above 1425 or a bearish close below 1375 should clarify the picture, as far as the $SPX chart goes.

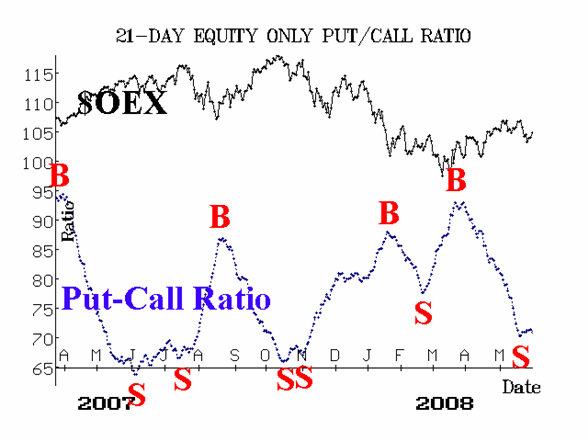
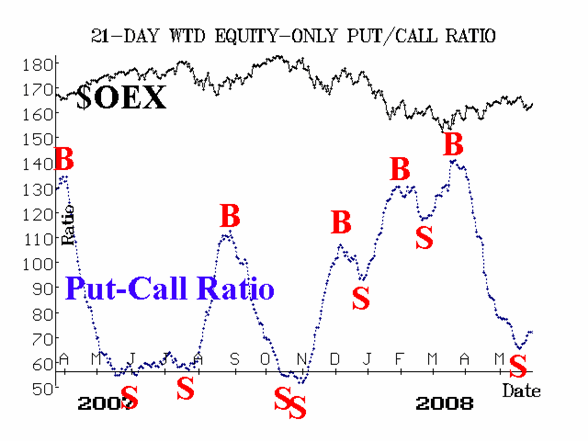
The equity-only put-call ratios are less ambiguous: they are bearish. After generating sell signals last week, they have not wavered. These intermediate-term indicators had been on buy signals since March, so the fact that they have rolled over to sell signals is meaningful. It is possible, I suppose, that a double sell signal could occur -- similar to what happened in October, 2007, and in June-July, 2007, although it is certainly not necessary for that to be the case.

Market breadth remains weak, and the breadth oscillators continue to remain on the sell signals that they first issued last week. Admittedly, this is the fifth such signal since the March bottom, and none have been particularly rewarding. Typically, during a rally such as we saw from mid-March to mid-May, breadth would expand tremendously and the oscillators would get very overbought eventually leading to a strong sell signal. However, that was not the case. Breadth was so tepid during the advance that the oscillators have barely reach overbought territory before falling back again. The breadth sell signals would be canceled out, if advance exceed declines by 1,200 issues over the next two days.

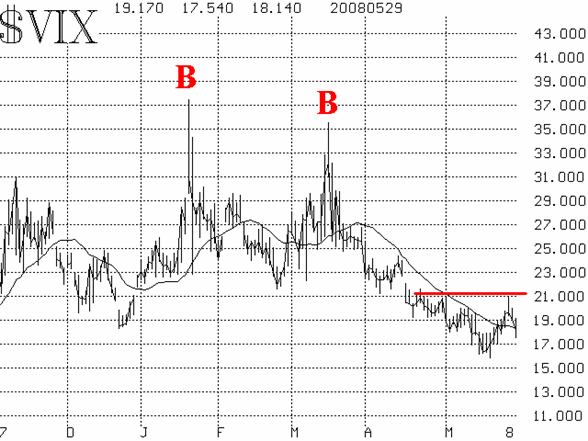
The volatility indices -- $VIX, in particular -- did not confirm the sell signals issued by the other indicators. $VIX remains in the bullish downtrend that has existed since its March highs (i.e., the market's lows). Yes, it did rise above its 20-day moving average briefly, but it did not overcome the 20 level -- an area which it has not closed above in nearly a month.

Volatility derivatives remain in an overbought state, but have not issued outright sell signals, either. The term structure of the futures remains the same as it has for some time now: a relatively large premium on the front month futures, and much larger premiums on the next two months. This is normally a bearish setup, but the structure must begin to flatten out before the actual bearishness comes to fruition. The large premium on the July and August futures (3.94 and 4.46, respectively) is also a bearish setup as well -- although it's persisted for so long that one wonders if and when the premium will eventually shrink.
In summary, last week's sell signals have not panned out. But this week's rally hasn't really been able to reverse them. Thus, neither the bullish nor the bearish case appears strong at this juncture. What we expect will happen -- mostly because of the sell signals in the equity-only put-call ratios and the large premiums in the $VIX futures is that this current rally will top out without exceeding the May highs; then the 1375 level will be broken. That will establish a pattern of lower highs and lower lows, and a larger downward move will ensue. However, a move above the May highs would cause us to re-evaluate this scenario.
Lawrence G. McMillan is the author of two best selling books on options, including Options as a Strategic Investment, recognized as essential resources for any serious option trader's library.
|