| Is Oil Reversing Or Retesting? |
| By Price Headley |
Published
05/31/2008
|
Futures , Stocks
|
Unrated
|
|
|
|
Is Oil Reversing Or Retesting?
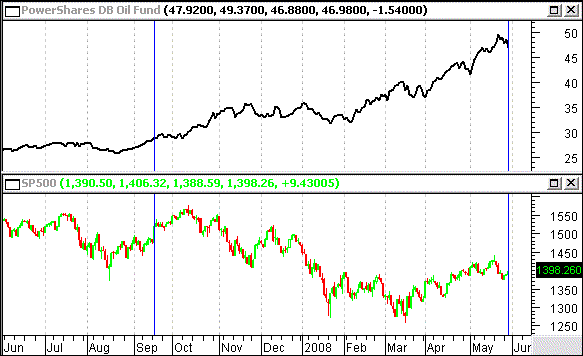
Since September when the Federal Reserve started a series of rate cuts, a barrel of oil jumped from $70 to $130, a rate of increase far above normal and arguably a bubble. From that point on options traders have been betting on trend continuation or top reversals. Picking the top or bottom in any stock, commodity or market is equally as difficult and oil is no different. There are, however, a few indicators that demonstrate whether Thursday's decline is evidience of more weakness or simply a low risk entry (retest). The markets have lacked any real trend since September, but the S&P 500 has been more negative than positive, on the other hand Oil ETFs, such as PowerShares Oil Fund (DBO), has remained in a steady uptrend throughout that same period. Let's take a look at some of my favorite indicators to shed some light on the recent downturn in energy and oil stocks.
DBO vs SPX- Daily

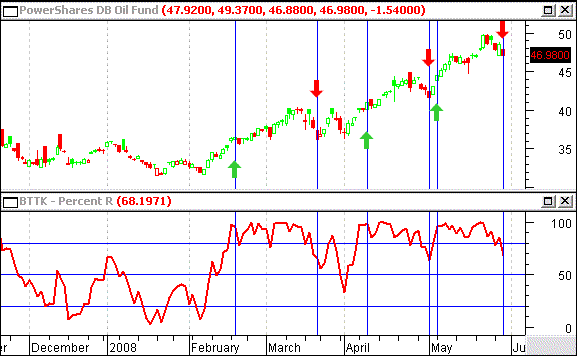
For strong trending stocks my top indicator is Williams' %R, if you're not familiar with the original concept you can find out more here, but we customized settings to optimize Percent R's effectiveness. There are three key levels to notice, 20, 50, and 80 percent levels: below 20 meaning oversold and above 80 signaling overbought and 50 a key midpoint. The key here is not to fight strong trends, we find better profits going against common theory, so we buy "overbought" and sell "oversold."
Take a look at DBO below, you'll see the strength in trend quantified by %R staying above 80 for the majority of the last eight months. In a closer look, the green arrows represent buying call options on DBO based solely on %R confirmation entries, while the red arrows are exits.
At first glance, you'll notice some give back on the exit, which is why we always lock half our gain at 100% and a quarter at 200% gain, which DBO provides in the positions below. Back to the real question: Is Oil Reversing or Retesting? Based on %R the retest key level was 47.58 for DBO - that level was violated at Thursday's close of 46.98. Technically speaking, this warrants an exit for your oil plays. As you can see, these %R violations alone have been helpful, but not perfect, after other, recent %R violations DBO continued the trend.
DBO with %R - Daily

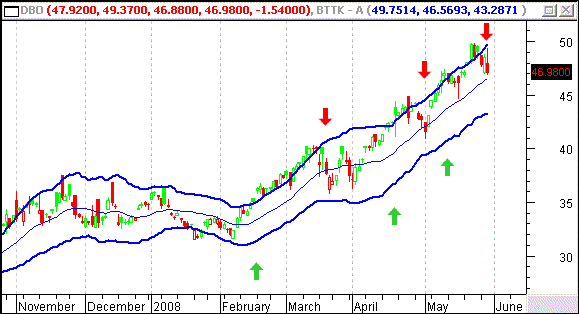
Another indicator that compliments %R are Price Headley's Acceleration Bands, these are designed to show persistent trends. The chart below shows DBO with 20 day Acceleration Bands:
DBO with Accereration Bands - Daily

First notice the SELL arrow from yesterday, the Acceleration Bands are independently confirming our %R retest violation. The bands are showing that the risk of reversal is too strong to stay in a bullish position here. This does not remove the possibility of another bullish surge (does anyone think $150 per barrel is possible?), but it's time to lock down those profits.
Based on this quick analysis using Percent R and Acceleration Bands, oil has declined enough to exit your call positions. To answer the original question, if oil is retesting or reversing, it has declined far enough to fail retest standards, but it has not shown real evidence of reversal yet. As far as oil is concerned we'll be on the sidelines for the next couple of days, at least until we see two breaks above the Acceleration Bands complimented by a %R confirmation.
Price Headley is the founder and chief analyst of BigTrends.com.
|