| Weekly Outlook In The Stock Market |
| By Price Headley |
Published
06/2/2008
|
Stocks
|
Unrated
|
|
|
|
Weekly Outlook In The Stock Market
NASDAQ Composite
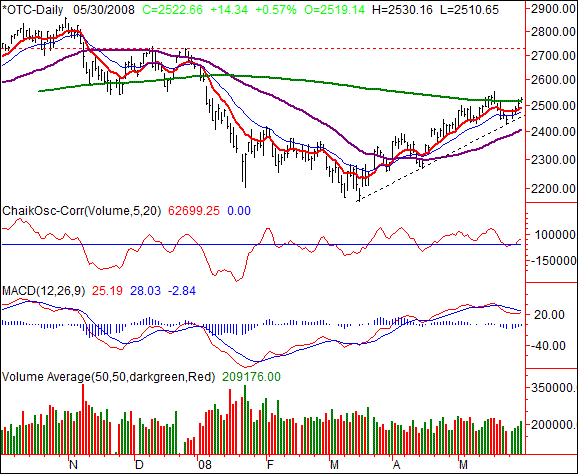
On Friday, the NASDAQ gained 14.34 points (+0.57%) to end the day at 2522.66. For the week, that meant a 3.19% move -- a close 77.99 points better than the prior week, and a quick dousing of bullish flames. If indications are correct, the odds favor more upside in the near term.
If you wanted to make a bullish argument, start with the NASDAQ. In fact, you could almost end with the NASDAQ. Why? It's back above the 200-day line for the second time in two weeks, this time after pushing off an important intermediate-term support line.
Volume has been outstanding too -- enough to push the Chaikin line into a bullish positions. A bullish MACD cross is imminent. Our first upside checkpoint is 2727, where we peaked in December. Support is at 2460, and rising.
NASDAQ Composite Chart - Daily

S&P 500
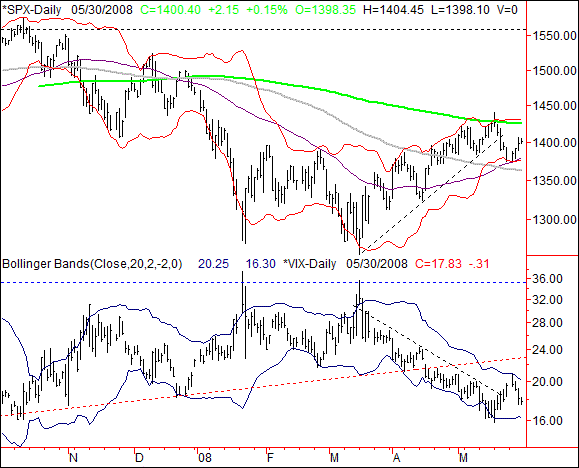
The S&P 50o's close of 1400.40 on Friday was the result of a 2.15 point (+0.15%) move. That's not a lot, but on a weekly basis, we saw the large cap index move 1.78% (+24.45 points) higher. Like the NASDAQ, this small gain also strengthened bullish arguments.
As we previously mentioned was likely, the 50-day moving average line as well as the lower Bollinger band (20 day, 2 sd) ended up stopping the SPX's decline, and setting up a rebound. And, there's still more upside room to travel before a ceiling is hit.
That resistance is of course the 200-day average and the upper Bollinger band, both right around 1429. There's a little potential for a small scalp trade between here and there, but the real fireworks could begin with a close above 1429.
It could indeed play out that way, though the VIX will probably have the final say. It too has a little more room to fall (while stocks rise) before finding a floor at 16.25. If it hits its lower band and just continues to pres it lower like we saw in April, well look for the bulls to climb a wall of worry.
Can the VIX actually get any lower? We'll remind you the VIX stayed around 10 for months not that long ago, so yeah, it can happen. Beware a move back under the 100-day average at 1363.
S&P 500 Chart - Daily

Dow Jones Industrial Average
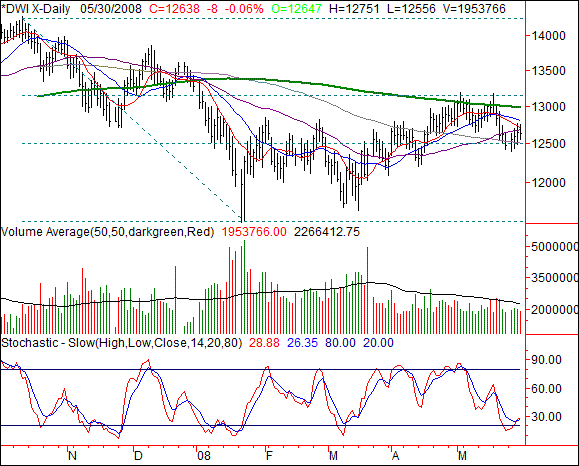
The Dow ended up losing ground on Friday, though not by much. The 21.82 point dip (-0.17%) led the blue chip index to a close of 12,624.40. On a weekly basis, though the Dow was once again the laggard, we saw the index gain 144.77 points, or 1.16%. While numerically the Dow may feel the weakest, in some regards it has the most upside potential as it catches up...if it catches up. There's still a ceiling to work past.
The ceiling is the mostly-converged 10-, 20-, and 50-day moving averages. Let's just call it 12,750. Even then, there's some more resistance just above that mark. The bulls' line in the sand is really 13,190, where we peaked last month.
There is one thing the Dow has going for it though. It was stochastically oversold, but is now correcting that situation. That could propel the Dow past the 13,190 mark, and if it does, we'll look for a move to 14,280.
On the flipside, support is at 12,516. A couple of closes under there will likely spell trouble.
Dow Jones Industrial Average Chart - Daily

Price Headley is the founder and chief analyst of BigTrends.com.
|