| The McMillan Options Strategist Weekly |
| By Lawrence G. McMillan |
Published
06/6/2008
|
Options
|
Unrated
|
|
|
|
The McMillan Options Strategist Weekly
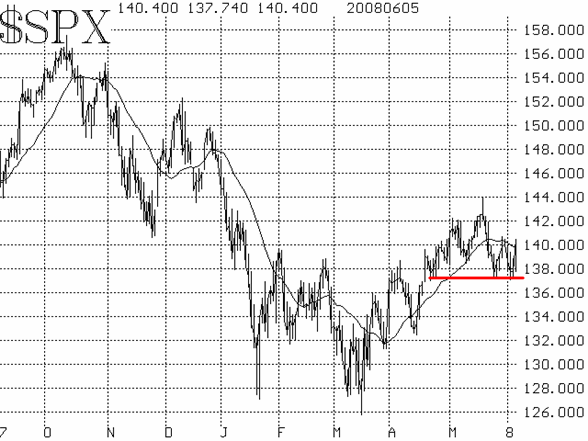
This has been a volatile week couple of weeks, with $SPX rollicking between 1370 and 1405 a couple of times. In fact, today it nearly traversed the entire range in one day. This sets up a potentially volatile unemployment report for Friday morning. In fact, that report was probably one reason why the market rose so much on Thursday. Has the data been leaked? Always possible, of course, but more likely is the fact that shorts did some covering on Thursday -- and it got a bit carried away -- so they didn't have to buy into a potentially sharply rising market in the wake of a positive report Friday morning.
In the broader sense, we are not concerned with one set of economic numbers which the government has every reason to bias in its favor. Rather, we use the "purer" technical indicators of the market itself.
First, the $SPX chart is relatively neutral, with the index bouncing back and forth in the afore-mentioned range. However, the 20-day moving average is now declining, and so as long as that resistance at 1405-1410 holds, the index has a slightly negative bias. A series of lower highs and lower lows would have made the bearish case. But the index never closed below 1370, so that bearish sequence has not yet been established. At this point, a close below 1370 would certainly be bearish. Meanwhile, a close above 1405-1410 would likely indicate another run at the May highs.

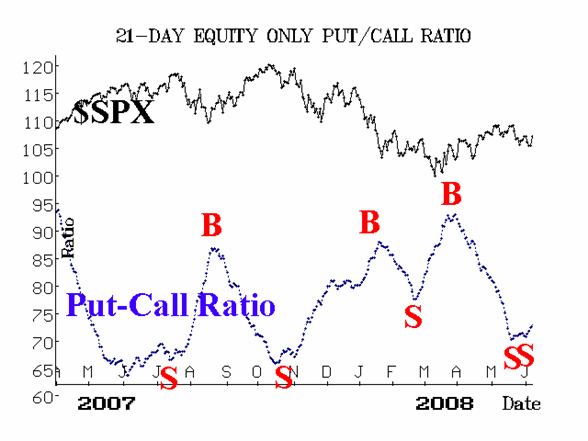
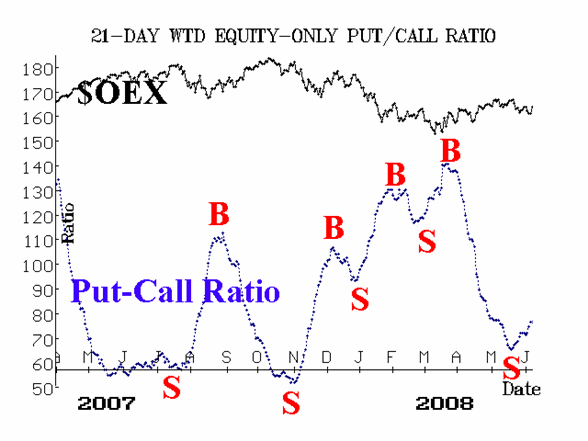
The equity-only put-call ratios are bearish. The standard ratio (Figure 2) wavered a bit earlier this week, but re-confirmed its sell signal after that. The weighted ratio (Figure 3) has remained steadfastly on its sell signal. Since these are important intermediate- term indicators, we view their bearishness as meaningful.

Less meaningful is market breadth, which has been notoriously weak and somewhat indecisive all year. At the current time, the last signal was a sell signal, and technically that is still in effect.

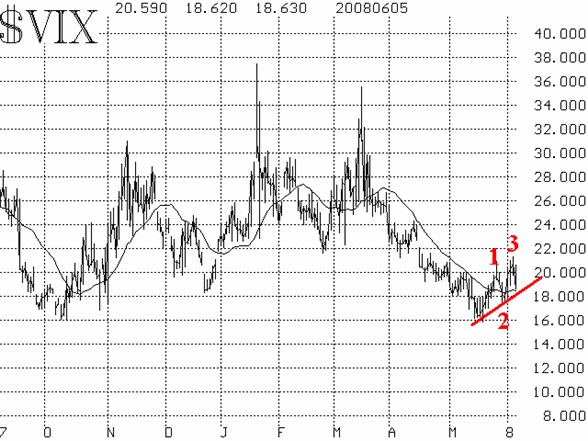
The volatility indices ($VIX and $VXO) have been rising for the last couple of weeks. $VIX did establish a series of higher highs and higher lows (see Figure 4), and so this chart is now in an uptrend. An uptrend in $VIX is bearish for the broad stock market. Even today's sharp decline in $VIX didn't change that fact. A $VIX close below point 2 on the chart, at 17.83, would disrupt this bearish pattern.

In summary, the bears had their chance to break this market, but when $SPX failed to close below 1370, a massive short-covering rally took place (the market was not very oversold at the time, but there is always plenty of buying power -- especially when it acts in concert). There are still sell signals from the put-call ratios and a bearish $VIX chart. But if $SPX closes above 1410 and if $VIX closes below 17.83, that would turn the picture bullish, despite the put-call ratio sell signals. We may find out quickly -- as soon as today -- if that will be the case or not.
Lawrence G. McMillan is the author of two best selling books on options, including Options as a Strategic Investment, recognized as essential resources for any serious option trader's library.
|