| Weekly Outlook In The Stock Market |
| By Price Headley |
Published
06/8/2008
|
Stocks
|
Unrated
|
|
|
|
Weekly Outlook In The Stock Market
NASDAQ Composite
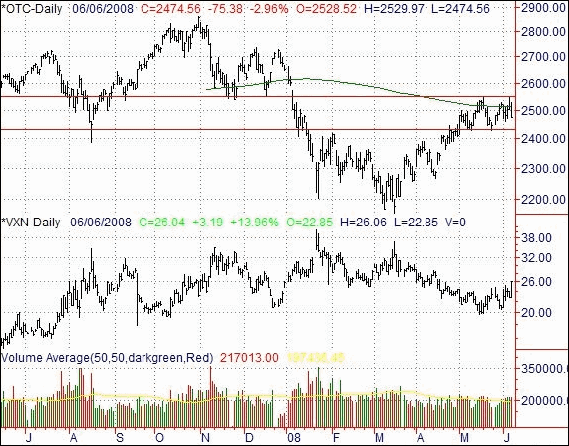
Despite substantial losses on Friday, the NASDAQ's overall uptrend is still intact. The tech-heavy index fell 75.38 points, or 2.96%, to end the day at 2474.56. For the week, the NASDAQ lost 48.10 points, or 1.91%.
Our biggest concern here is the degree of trouble we've seen from the composite right as the 200-day moving average line was encountered. We thought on Thursday we finally had it licked. Guess not.
On the other hand, were still within striking distance, so we don't want to get too bearish just yet.
At this point the support line at 2428 is the key level to be watching. By the same token, the resistance at 2550 is also a big deal. A break past that mark could be huge, while a break under 2428 could be devastating. We'll be in "wait and see" mode until the NASDAQ breaks out of this narrow range.
Side note: Though the VXN popped pretty good on Friday, it really didn't hit an extreme high. That's actually a strike against the bulls in favor of the bears? We're not seeing the same peak in fear as we are for the other indices. Of course, why should we? Even with Friday's dip, the NASDAQ is still doing pretty well? Much better than other indices.
NASDAQ Composite Chart - Daily

S&P 500
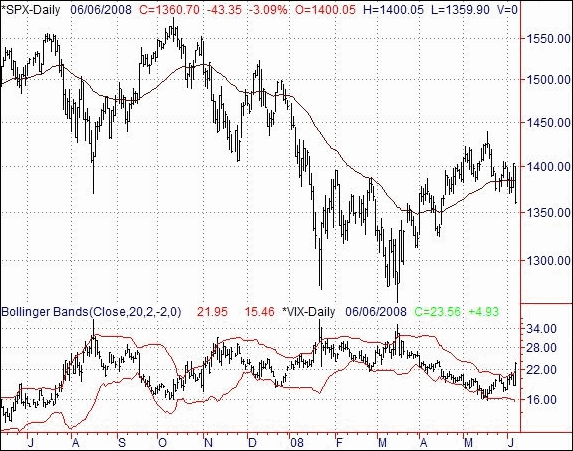
The close of 1360.7 on Friday came as a result of the 43.35 point loss (-3.09%). On a weekly basis the large cap index sank by 39.7 points, or 2.83%. In other words, had it not been for Friday the S&P 500 would have closed in the black.
The size of the loss brings back memories of earlier in the year, but we would caution you against assuming we'll see a repeat of that. Based on what we see in the VIX, Friday's peak in fear many be setting up a decent bounce.
Though the VIX was of training anyway, the sharp move higher on Friday pushed the index well past its near term ceiling. Had the VIX just run up into the upper Bollinger band line, we may have been able to assume the VIX would just follow the trend line higher. Instead we saw the VIX pop above it. As you can see from the charts recent history, strong moves well above the upper Bollinger band line have usually come at significant bottoms.
Aside from the VIX, most everything else looks bearish. But again, the size of Friday's sell off was suspicious.
That being said, you may not want to get bullish again until the SPX moves back above its 50-day moving average line at 1384.
S&P 500 Chart - Daily

Dow Jones Industrial Average
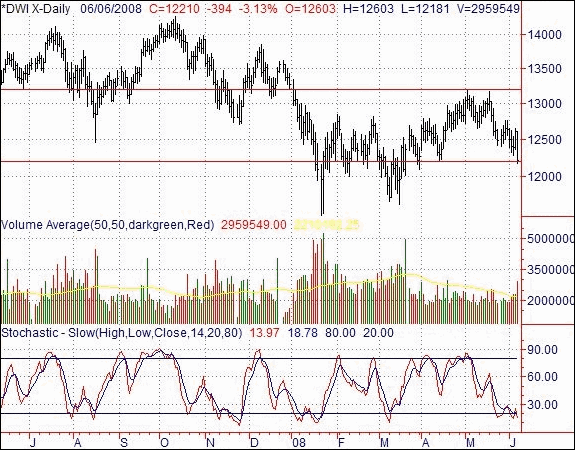
On Friday the Dow Jones Industrial Average fell 394 points to end the day at 12,210. That was a 3.13% loss -- the worst single day loss in a long time. For the week, the blue chip index fell 428 points under the prior week's close, closing at 3.39% below the previous Friday's closing level. As bad as the numbers look, they were so bad on Friday we might be facing at least a dead-cat bounce.
That's going to be the key here if the bulls are to have any shot here at survival, since not much else looks very healthy. The only thing we see that might help is a little resistance around 12,200. Also, check out stochastics. Both the%K and %D lines are under 20. We all know quite well how the market can get oversold and stay oversold a long periods of time. However, in this environment is just less likely. None of the last four instances of being oversold did not result in a trade-worthy bounce.
Dow Jones Industrial Average Chart - Daily

Price Headley is the founder and chief analyst of BigTrends.com.
|