| Comparing S&P To Crude Oil Illustrates Market Weakness |
| By Mike Paulenoff |
Published
06/9/2008
|
Futures , Stocks
|
Unrated
|
|
|
|
Comparing S&P To Crude Oil Illustrates Market Weakness
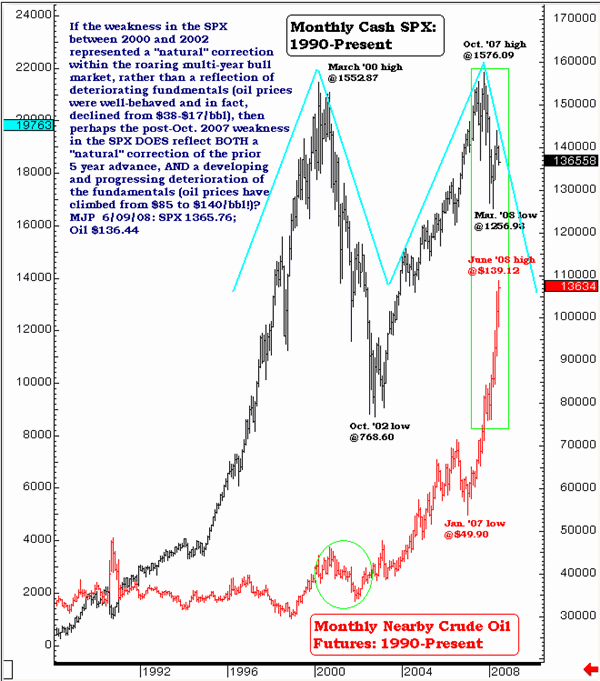
My big picture view of the S&P 500 compared to the price action of crude oil concludes that I need to get long the UltraShort S&P 500 ProShares ETF (SDS), or short the SPY, at some point today. If the weakness in the S&P 500 between 2000 and 2002 represented a "natural" correction within the roaring multi-year bull market, rather than a reflection of deteriorating fundamentals (oil prices were well-behaved and in fact declined from $38 to $17bbl), then perhaps the post-October 2007 weakness in the SPX does reflect both a "natural" correction of the prior 5-year advance and a developing and progressing deterioration of the fundamentals (oil prices have climbed from $85 to $140/bbl).

Mike Paulenoff is a 26-year veteran of the financial markets and author of MPTrader.com, a real-time diary of his technical chart analysis and trading alerts on all major markets. For more of Mike Paulenoff, sign up for a free 15-Day trial to his MPTrader Diary by clicking here.
|