| Buy And Hold Doesn't Always Work |
| By Price Headley |
Published
06/9/2008
|
Stocks
|
Unrated
|
|
|
|
Buy And Hold Doesn't Always Work
Throughout most of the 1980's and 1990's, a "Buy and Hold" strategy on the major blue chips stocks was a very popular and often profitable strategy. However when you examine 4 of the biggest, most widely held names, this strategy has not worked well in this decade of the 2000's.
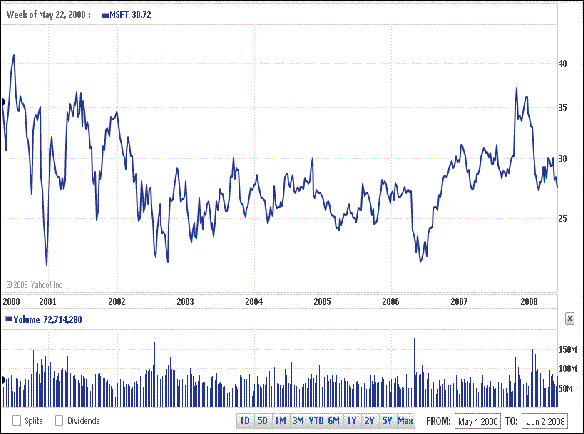
Microsoft (MSFT) and Wal-Mart (WMT), two giant household-name type companies, are held in countless investor portfolios and funds. However, unless your short-term entry timing was right, money invested in these behemoths has been "dead money" for most of this decade. Take a look at the MSFT long-term chart below
MSFT Long-Term Chart

MSFT has basically been land-locked between 25 and 35 since the year 2000. At an average cost of 30 (middle of this range), an investor would have made basically zero return in the past 8 years.
WMT Long-Term Chart

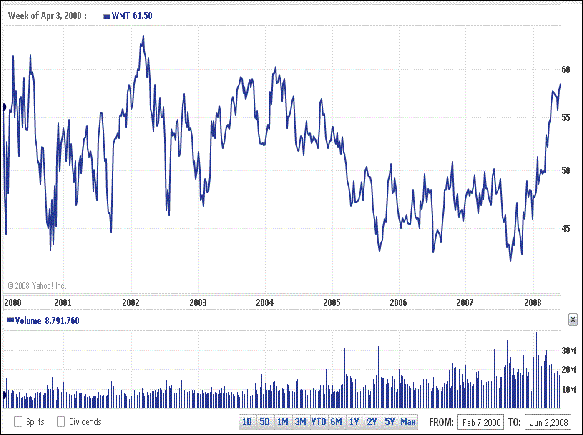
As the above chart shows, WMT has been largely range-bound between 45 and 60 since 2000. At the middle of this range around 52.5, an investor would have been underwater from 2005 to 2007, although it has rallied above this recently.
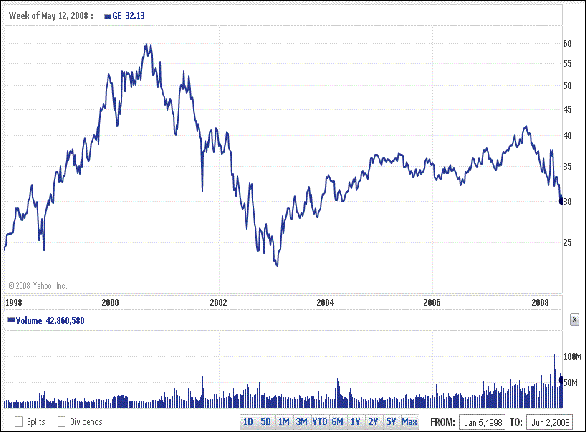
Two other big mega-caps that were believed to be among the "best of breed" for buy and hold are actually on the verge on penetrating to 10-year lows. If you examine the next chart, General Electric (GE) looks likely to head towards another test of its long-term low around 25.
GE Long-Term Chart

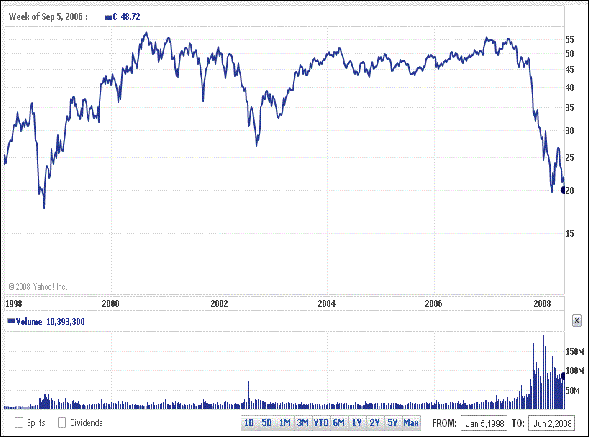
As the following chart shows, Citigroup (C) has felt the effects of the mortgage/credit crisis, and is right around its 10-year low around 20.
C Long-Term Chart

The bottom line is the simplistic strategy of "buy and hold" on blue chips stocks is no longer a guarantee of profits, or even a protection against losses. Today's "bluest of the blue chips" may be tomorrow's bloated, slow-growth, dead money stocks. The same is true of broad market indices and mutual funds in most cases.
While there is nothing wrong with buying blue-chip names to hold onto for an extended period of time, in all trades it is advisable to find low-risk entry points, in my view. This can be through the use of charts to find the bottom area of trading ranges, or on pullbacks towards moving averages, for example - or buying when sentiment is very low and all the news appears negative if your long-term view is still intact. Also, rather than "buy and forget about", a disciplined managed account that re-balances and re-allocates on a quarterly, semi-annual, or annual basis would seem to me to be a more advisable way to go.
Price Headley is the founder and chief analyst of BigTrends.com.
|