This is not a market where one can count on many of the patterns that are fairly reliable in less stressful market conditions. Intuit (INTU) has one of the few charts that is presenting a fairly attractive risk/reward opportunity on the long side.
Intraday market activity continues to point to seismic rumblings as macro switching strategies dominate. The real question is whether these rumblings are the after-shocks from last Friday's employment data or foreshocks for an even bigger test for the markets - dollar vulnerability.
There are undoubtedly some large asset management players who are trying to exploit the convictions behind the newly found hawkishness of central bankers and I would suggest paying particular attention in coming sessions to the currency markets, Asia and the emerging markets in general where there is plenty of evidence that the hot money is on the move.
Meanwhile the small cap index, the Russell 2000 (^RUT), is still showing signs that it is holding above key support at the 50-day EMA without yet displaying signs of a breakdown. Based just on the technical picture, and intrigued by the tiny doji star formation from yesterday, I am still of the view that there is accumulation taking place among the small caps. Even though it may be too much to say that they could provide leadership out of this correction, there is no evidence that fund managers are throwing in the towel on these lower profile stocks.
Ironically the bears could argue that this very fact provides further fuel for heavy shorting as it would be capitulation behavior when there is panic among the long only institutional managers, when they start throwing out their small cap holdings, that would be the signal for the short sellers to finish taking profits from the current correction. 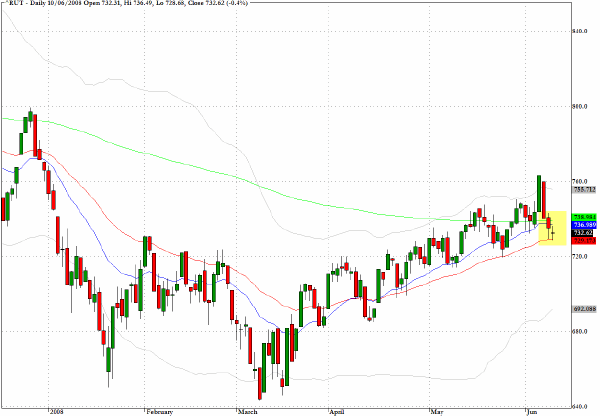
Treasury traders seem to have accepted the fact that 4% may now be a support level on the yield for the ten-year Treasury note. Apart from the questions about the sincerity of the Fed in fighting inflation, there appears to be a realization that making yields more attractive in the globally competitive government bond market is part of the overall attempt to underpin the dollar. 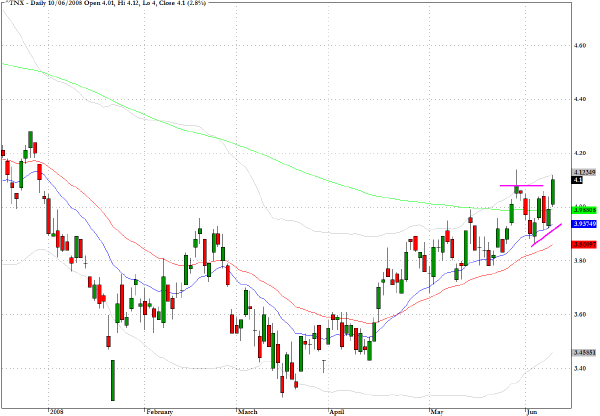
The chart for the Midcap 400 index (^MID) will be a primary focus for me today, and I will be looking for signs of any violation of the short term upward trend line that has been drawn on the chart. 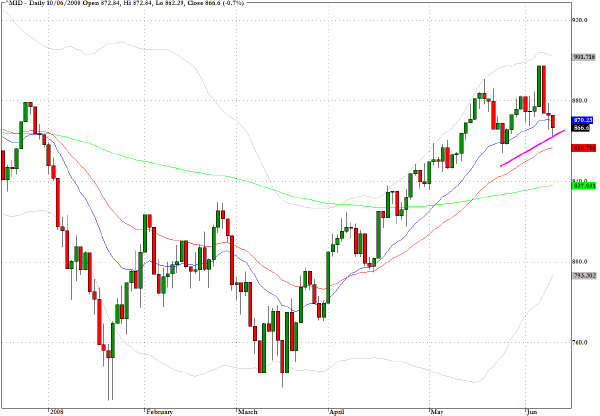
I could have chosen any one of many sector funds that track various Asian and emerging markets to illustrate the fact that capital is definitely moving out of many of these markets. In Monday's letter I featured the bearish complexion of the FXI fund which represents Chinese stocks and in yesterday's trading there were several breaks below key support levels for many emerging market funds including EEM.
The fund for the Taiwan market (EWT) broke below its 200-day EMA and the MACD and MFI divergences show that this market could struggle to find support if a re-test of the mid March levels was to reveal a failure pattern. 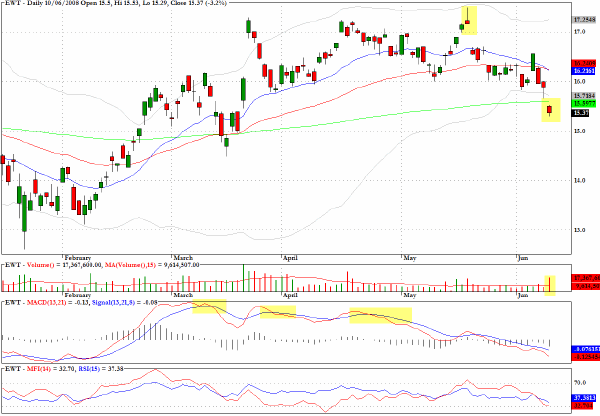
Several weeks ago I suggested that I believed that gold would become more compelling on the long side as the spot price came back towards $835. I am looking at the chart for the exchange traded sector fund, GLD, and would not be surprised to see buyers showing interest as the early May levels are touched. 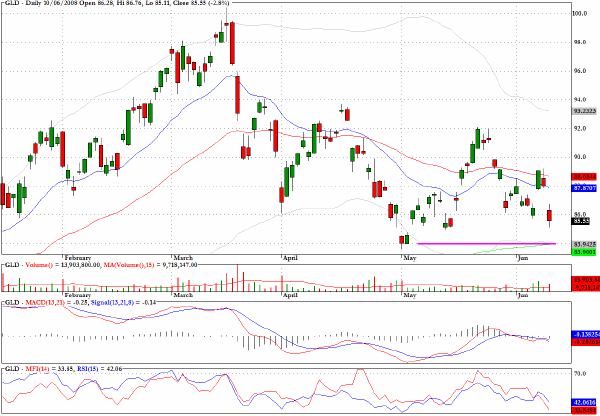
PanAmerican Silver (PAAS) could also fit into the imminence of some basing activity in the precious and semi-precious metals. The retreat to the levels seen last December could also attract some interest although I would prefer the story on gold to that for silver. 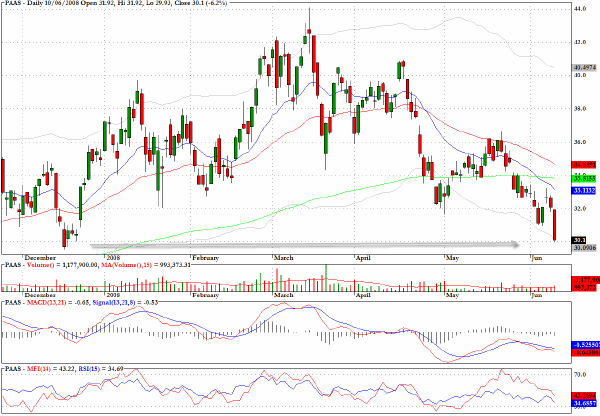
Many individual charts are rather confusing at present and this is not a market where one can count on many of the patterns that are fairly reliable in less stressful market conditions. Intuit (INTU) has one of the few charts that is presenting a fairly attractive risk/reward opportunity on the long side. 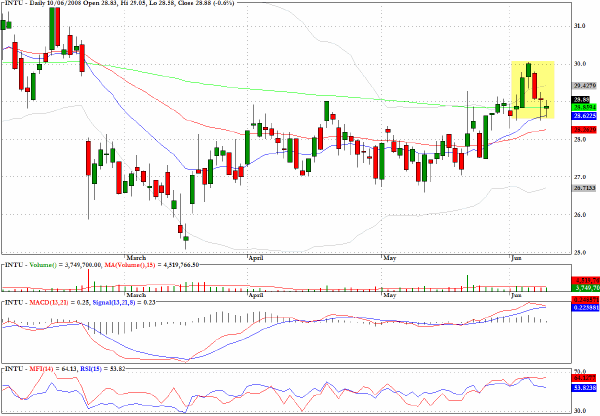
Clive Corcoran is the publisher of TradeWithForm.com, which provides daily analysis and commentary on the US stock market. He specializes in market neutral investing and and is currently working on a book about the benefits of trading with long/short strategies, which is scheduled for publication later this year.
Disclaimer
The purpose of this article is to offer you the chance to review the trading methodology, risk reduction strategies and portfolio construction techniques described at tradewithform.com. There is no guarantee that the trading strategies advocated will be profitable. Moreover, there is a risk that following these strategies will lead to loss of capital. Past results are no guarantee of future results. Trading stocks and CFD's can yield large rewards, but also has large potential risks. Trading with leverage can be especially risky. You should be fully aware of the risks of trading in the capital markets. You are strongly advised not to trade with capital.