| A Mid-Week Look At The Market |
| By Price Headley |
Published
06/11/2008
|
Stocks
|
Unrated
|
|
|
|
A Mid-Week Look At The Market
June has been a very poor month so far for the major indices in terms of performance. Let's step back a bit and look at the longer-term weekly charts to see where we stand from a technical perspective.
S&P 500 Index (SPY)

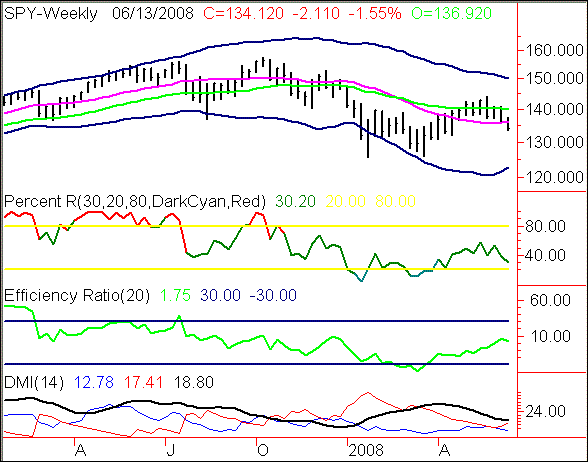
The S&P 500 Index (using SPY ETF here) is about in the middle of its Weekly Acceleration Bands, just below its Middle Band. Not seriously broken down as of yet, but concerning that it is below its 40-Week Exponential Moving Average (green line). The Percent R reading is heading towards bearish territory, but the Efficiency Ratio reading is about in its middle range. The ADX reading at the bottom (black line) is fairly low and slightly downtrending, indicating the general trend strength of the SPY is not that strong. It appears that the Positive DMI (blue line) failed in its attempt to crossover the Negative DMI (red line), which looks to be fairly bearish
The sum of the indicators on this chart to me is indicating a general sideways/downwards trading range, with a bearish leaning. Downside support could come from the 130 and 125 strikes, and beyond that is support by the Bottom Acceleration Band, around 123 currently and slightly rising.
NASDAQ 100 Index (QQQQ)

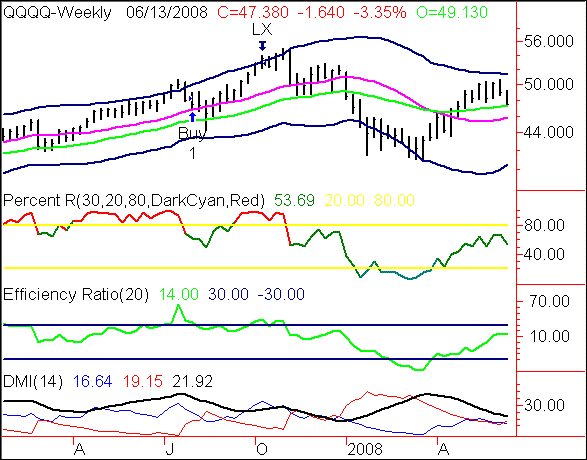
The NASDAQ 100 (QQQQ ETF) has been an outperformer vis-à-vis the S&P and Dow Industrials over the past few weeks, but is facing significant weakness in recent days. As you can see the above weekly chart, the QQQQs are still above their Middle Bands and 40-Week Exponential Moving Average. But it looks to somewhat 'rolling over' after it approached its Top Band. In addition the Percent R and Efficiency Ratio appear to be faltering after moving towards the key 80 and 30 levels, respectively. ADX is showing a weakening of the trend here as well. I would still expect this Index to resume its outperformance in relation to the other major indices, but a pull back to the Middle Band around 46 would not be surprising at all.
Dow Jones Industrial Average (DIA)

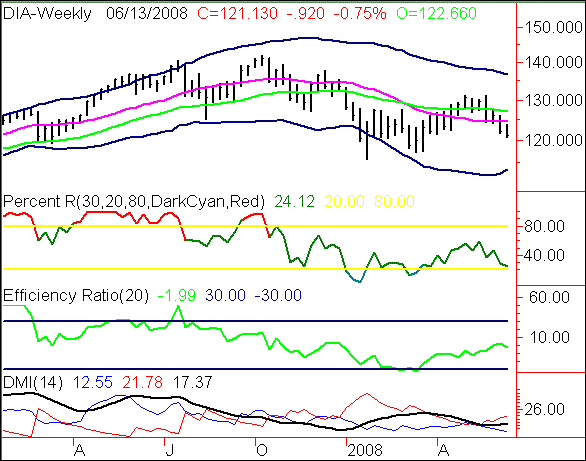
The Dow Jones Industrial Average (DIA ETF) chart is similar to the SPY. But the key Percent R reading looks a bit worse here and appears to be heading towards a test of the key 20 bearish level. Once again the Efficiency Ratio looks better than the Percent R for this chart -- on all three above charts this is the case, there is kind of a tug-of-war going between these two key technical indicators -- but when in doubt, I would favor Percent R over Efficiency Ratio.
Price Headley is the founder and chief analyst of BigTrends.com.
|