| Corcoran Technical Trading Patterns For June 12 |
| By Clive Corcoran |
Published
06/12/2008
|
Stocks
|
Unrated
|
|
|
|
Corcoran Technical Trading Patterns For June 12
There are some rather remarkable charts to show today and the seismic rumblings that I talked about in Tuesday's letter are now causing tectonic dislocations that look rather ominous. This is a very threatening environment for long-only fund managers, but the fact that many hedge funds are piling up massive rewards also suggests that there will be some dramatic reversals ahead.
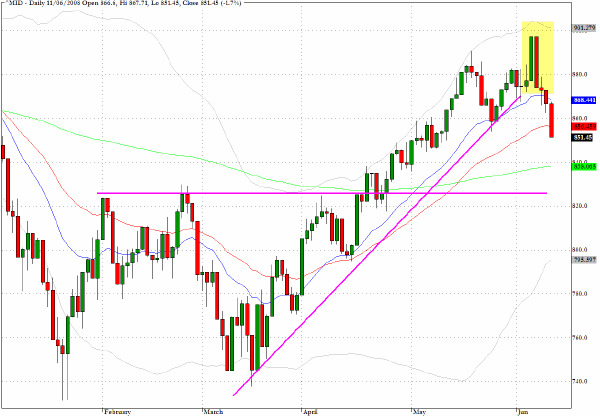
The S&P 400 Midcap (^MID) dropped below some key levels yesterday but still, unlike the Russell 2000 (^RUT), it remains above the 200-day EMA.
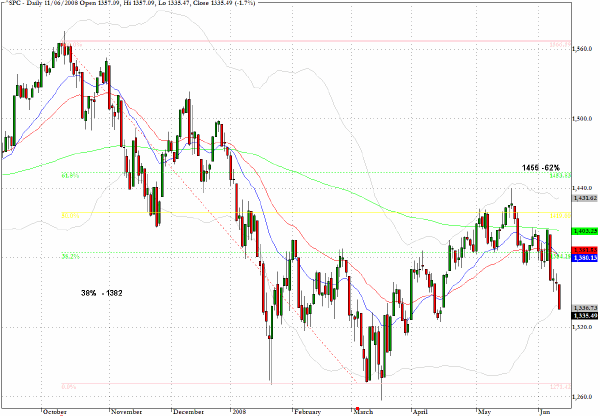
The S&P 500 (^SPC) came to rest in a no-mans land at 1335 and well below the 38% retracement level around 1380. As I have marked on the chart, the index failed to make the 1455 retracement level that I had targeted several weeks ago as it halted at 1440. Now it is hard to resist the conclusion that the mid-March low will be tested in the intermediate term.
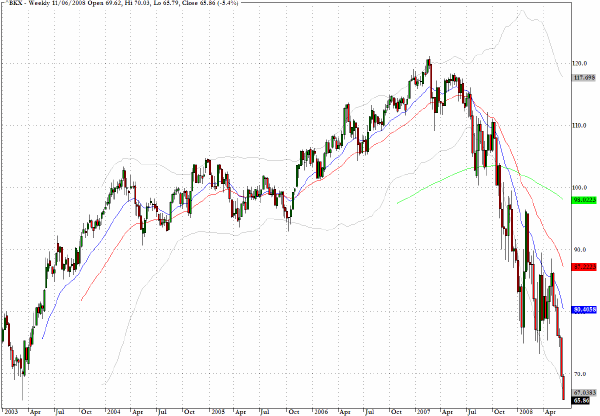
The banking index (^BKX) appears to be in free fall and the close yesterday dropped below the levels seen in the spring of 2003. It is very hard to call any kind of sustainable bottom for the S&P 500, when such a critical sector of the economy seems to be without a bid.
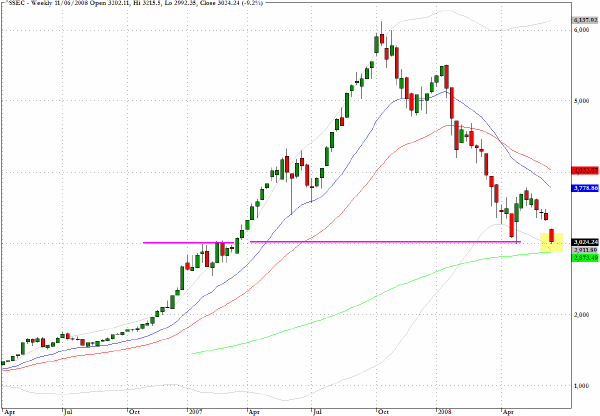
A long-term weekly chart for the Shanghai Exchange (^SSEC) shows that the 200-week EMA and a chart support level lie in the region of 2900 which is about 50 points below today's close.
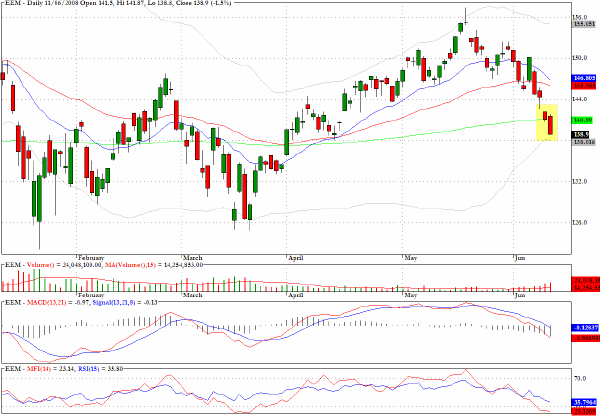
The exchange traded sector fund which tracks the MSCI Emerging Markets Index, EEM, has broken below the 200-day EMA.
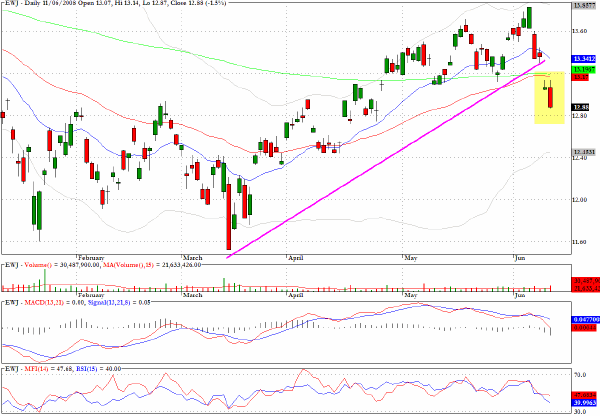
The last time I wrote about the exchange traded fund for the Japan index (EWJ) the technical condition looked a lot more constructive than it now does.
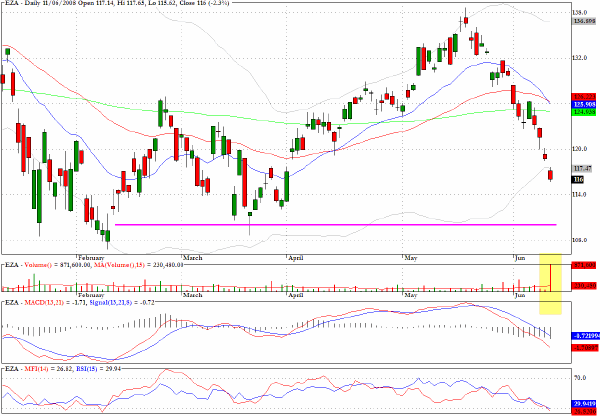
EZA which tracks the South African index is dropping precipitously and the volume yesterday was three times the average daily volume. Clearly the mid-March levels need to be tested.
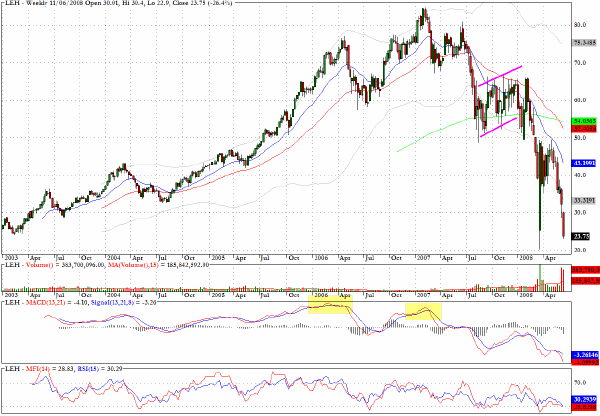
A long-term weekly chart for Lehman Brothers (LEH) could be causing some disquiet for those who contributed to the $6 billion re-capitalization. The best remark that was made regarding this sad story was made by David Einhorn when he said something along the lines that "They had to raise money which they said they didn’t need to cover losses which they had said they didn’t have."
Clive Corcoran is the publisher of TradeWithForm.com, which provides daily analysis and commentary on the US stock market. He specializes in market neutral investing and and is currently working on a book about the benefits of trading with long/short strategies, which is scheduled for publication later this year.
Disclaimer
The purpose of this article is to offer you the chance to review the trading methodology, risk reduction strategies and portfolio construction techniques described at tradewithform.com. There is no guarantee that the trading strategies advocated will be profitable. Moreover, there is a risk that following these strategies will lead to loss of capital. Past results are no guarantee of future results. Trading stocks and CFD's can yield large rewards, but also has large potential risks. Trading with leverage can be especially risky. You should be fully aware of the risks of trading in the capital markets. You are strongly advised not to trade with capital.
|