NASDAQ COMMENTARY
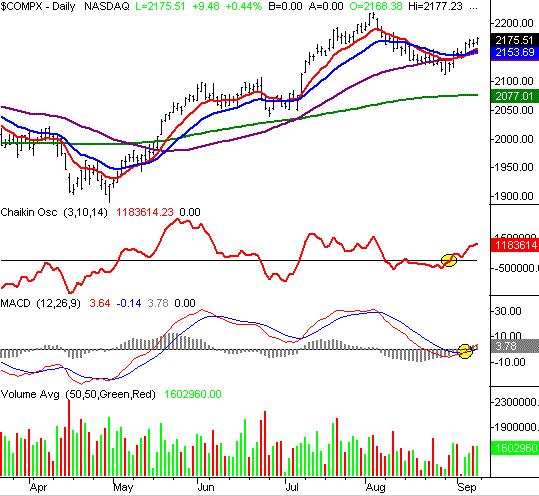
The NASDAQ gained 34.5 points last week, to close at 2175.51. That's about a 1.6 percent gain, and is even better than last week's move. The thing is, we think there could be more of the same in the near future.
The second week of big gains went a long way in convincing us that the tone has turned bullish. As we've pointed out a couple of times, this year has been plagued with a lot of back-and-forth movement, but each of those legs has been big (i.e. trade-able). So, the opportunity that's developed is more than a little exciting. The last two times the NASDAQ set up this pattern, it was good for an average gain of about 100 points. Carrying that 100 points forward from the point the composite went technically bullish last week, and you have a reading of 2250. That's about 75 points higher than where we are now, and would be an additional gain of about 3.5 percent. Like we said, it's exciting.
But what exactly is this pattern we say we keep seeing? Specifically, it's a cross of the 10 and 20 day lines (red and blue, on our chart). We crossed above these lines in May, and again in July. And each cross of these lines was the beginning of a major move higher. Seeing it occur now, we're planning on a similar result.
That, however, isn't the only bullish indication we've got. We're now well into MACD and Chaikin buy signal (see last week's report for the original analysis). Plus, we have raw momentum carrying us higher. Notice that we've made four consecutively higher highs, and four consecutively higher lows. (It would have been seven on both of those items, if trading hadn't slowed down so much in front of the Labor Day weekend.)
Potential pitfalls are still out there though. This year's high of 2219 could be a problem area. If we can indeed get past that, then 2250 isn't out of the question - just remember it could take a while to get there. As for support, the primary support levels are now going to be those important 10 and 20 day lines, currently at 2154/2157.
NASDAQ CHART - DAILY

DOW JONES INDUSTRIAL AVERAGE COMMENTARY
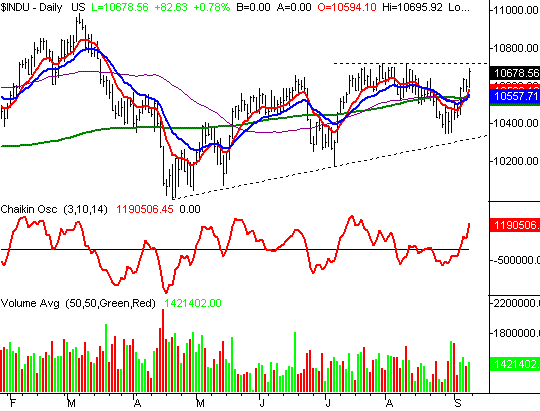
The Dow finally came to life last week, making a monster move from 10,447 to 10,678. That 231 point move translates into a gain of 2.2 percent, which tops all the other indexes. One week's worth of leadership doesn't mean the Dow stocks are now the hot (or only) place to put your investing dollars. However, it sure goes a long way in getting this index off the hot seat.
The "Most Improved" award has to go to the Dow. It had been in terrible shape - long-term as well as short-term - all year long. Now, we're sitting on top of one of the best weeks we've seen for the Dow in a while. And more than that, the chart suggests that we should get ready for more big numbers form this blue-chip index.
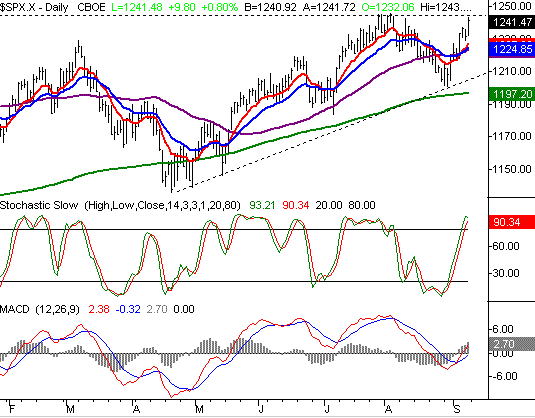
Where did it come from, and why all of a sudden? The answer to both questions is a healthy recovery. You can now see that all the indexes (and therefore all kinds of stocks) gained sharply this past week. In other words, there was broad participation in the bounce. Know how a rising tide lifts all boats? The same idea applies here. The Dow Jones Average broke out of its lull because there's genuine buying interest again, at least partially attributable to the inevitable rebuilding efforts that will result from hurricane Katrina. The other thing to keep in mind is this........since the Dow's stocks had trailed for most of the year, most investors are probably viewing them as the best bargain, whereas the NASDAQ's stocks may have already realized the biggest portion of their potential. It's also clear that the number of buyers is growing - the Chaikin line crossed into positive territory this week.
The end result of all that strength and bullish momentum is an index crossing above its key moving averages. In the case of the Dow, it happened to cross all of them at the same time...on Tuesday. We saw outstanding follow-through the rest of the week (and on higher volume, no less).
The next potential trouble area for the Dow is very, very close. This index was held under 10,719 for a couple of weeks in July and August, and then ultimately fell back after being unable to get past that line. So, we're certainly being cautious here. That 10,719 level is now only 41 points away, so it won't be long until that question is answered. In the meantime, we're bullish based on the current momentum, but it would cost nothing to wait and see if the market flinches once we get back to that resistance level. Just for the record, we don't think there should be any issues getting past that line; there's just too much bullish volume for the market to be skeptical.
Support is at 10,558, right where the 20, 50, and 200 day lines are all parked.
DOW JONES INDUSTRIAL AVERAGE CHART

Price Headley is the founder and chief analyst of BigTrends.com.