| Corcoran Technical Trading Patterns For June 19 |
| By Clive Corcoran |
Published
06/19/2008
|
Stocks
|
Unrated
|
|
|
|
Corcoran Technical Trading Patterns For June 19
Action in global equity indices was almost uniformly bearish yesterday with financials once again leading the parade downwards. The economic forecasts continue to focus on the twin problems of commodity based inflation which will require central bankers to be vigilant about monetary policy and on the other hand the downward spiral in consumer demand, real estate prices and credit availability. One of the most gloomy prognostications was the "leaking" of a private briefing that was given by the senior investment manager of the Royal Bank of Scotland that forecasts a rather dramatic fall in all global equities which, he claims, should unravel by the fall.
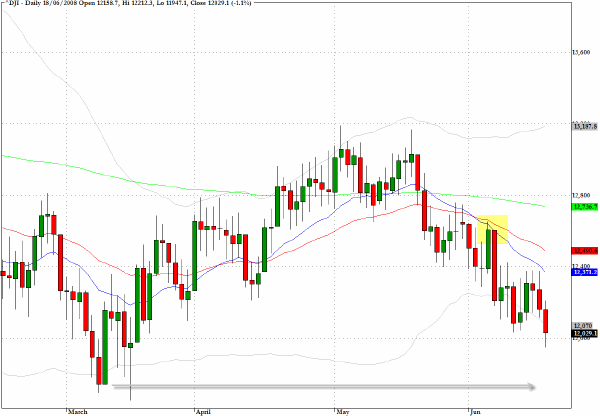
The Dow Jones Industrials (^DJI) is not one of the indices that I often focus on but the chart reveals how close we have come towards a re-test of the March low. What I do find intriguing is that while the March 17 low for this index seems almost certain to be tested and will take center stage when it is, there are some other US indices that are still quite a distance from comparable critical levels such as the S&P 400 Midcap index and the Russell 2000.
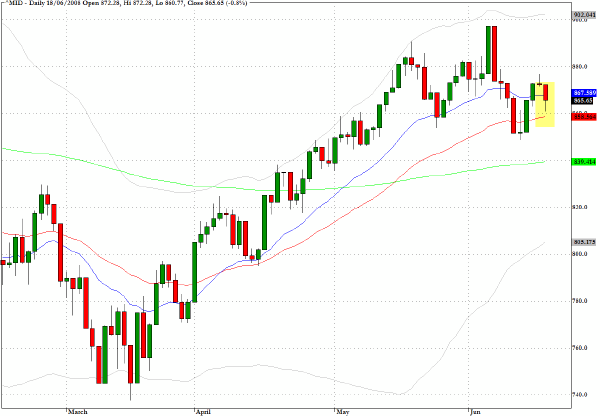
If one was to use the chart for the S&P 400 Midcap index (^MID) as representative of US equities one could afford to be a lot less gloomy about the technical conditions of the market than by focusing on the more "visible" indices such as the Dow Jones Industrials or the S&P 500.
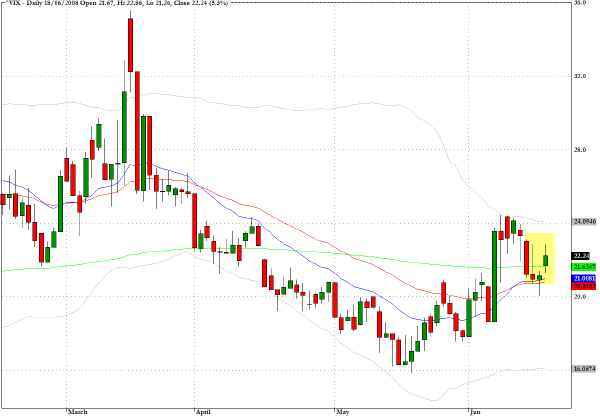
The CBOE Volatility Index (^VIX) has continued its move higher but the fear factor in the market still seems relatively contained given that we are coming down towards some critical levels.
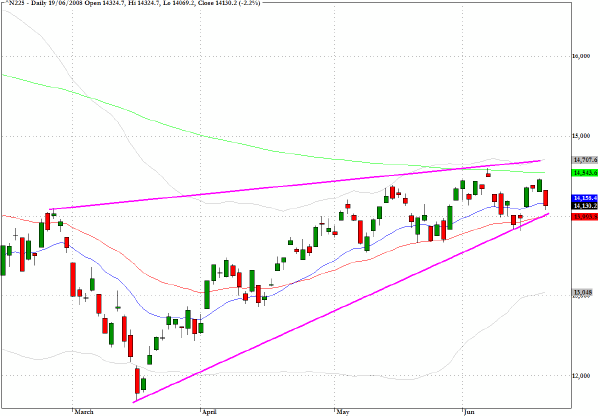
In overnight trading the Nikkei 225 (^N225) dropped back by more than two percent as did the Hang Seng Index. Reviewing the picture for the Japanese index there is now a rather clear triangular pattern emerging in which the 200-day EMA is acting as resistance and the 50-day EMA has so far provided support. Action is now squeezed into the apex of the triangle and a directional breakout when it comes should provide a vital clue as to the longer term resolution to this pattern. For now caution is suggested.
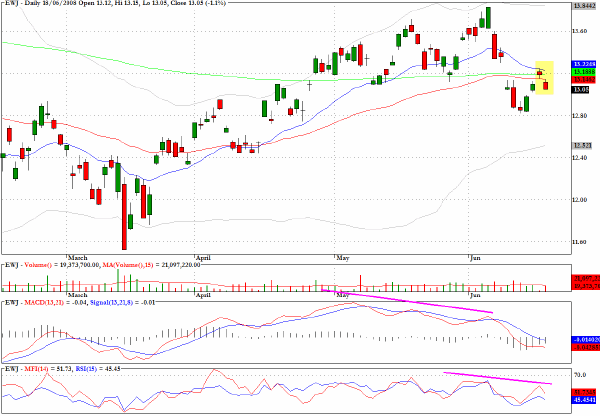
Having reviewed the Nikkei's chart formation it is also worth cross referencing the pattern for the exchange traded fund EWJ. The chart shows that as of yesterday's close, in other words prior to Thursday's trading in Tokyo, the fund dropped below two key moving averages and the negative MACD divergences are very apparent over the last couple of months.
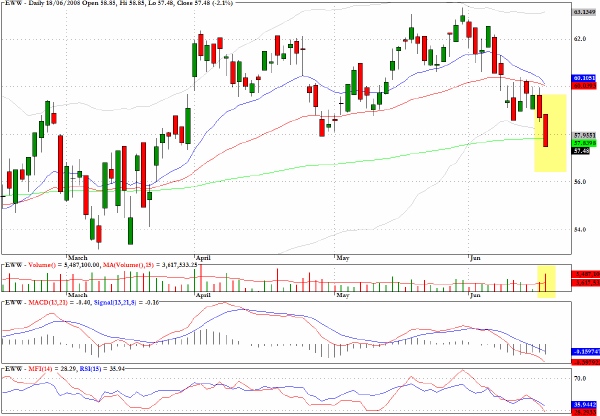
EWW, the exchange traded fund for the Mexican market, dropped sharply on substantial volume and the chart shows quite noticeable relative weakness in comparison to many of the other global markets.
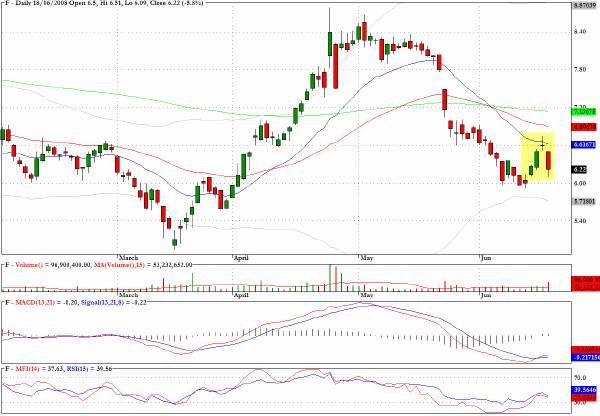
Ford (F) suffered yesterday as analysts become more gloomy about the fallout from endless increases in gasoline prices, and, after dropping back on very substantial volume, a text book example of the evening star candlestick pattern is revealed. Further downside is to be expected in the intermediate term.
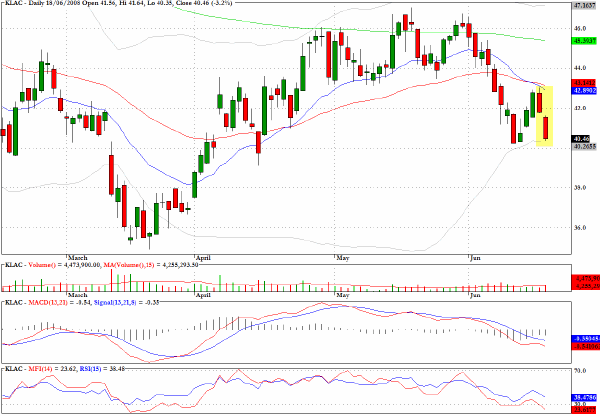
KLAC has not disappointed in the last two sessions for those that follow the bear flag formation.
Clive Corcoran is the publisher of TradeWithForm.com, which provides daily analysis and commentary on the US stock market. He specializes in market neutral investing and and is currently working on a book about the benefits of trading with long/short strategies, which is scheduled for publication later this year.
Disclaimer
The purpose of this article is to offer you the chance to review the trading methodology, risk reduction strategies and portfolio construction techniques described at tradewithform.com. There is no guarantee that the trading strategies advocated will be profitable. Moreover, there is a risk that following these strategies will lead to loss of capital. Past results are no guarantee of future results. Trading stocks and CFD's can yield large rewards, but also has large potential risks. Trading with leverage can be especially risky. You should be fully aware of the risks of trading in the capital markets. You are strongly advised not to trade with capital.
|