| Corcoran Technical Trading Patterns For June 23 |
| By Clive Corcoran |
Published
06/23/2008
|
Stocks
|
Unrated
|
|
|
|
Corcoran Technical Trading Patterns For June 23
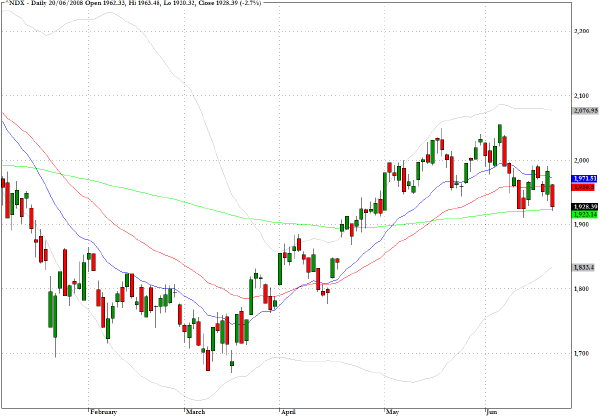
After Friday's sell-off and the continuing admission by the financial sector that there are yet further big write-downs ahead, market sentiment is becoming very gloomy. Many are now expecting the key level on the S&P 500 of 1270 to be tested and many of those are expecting that it will not hold. This tends to stir the contrarian instincts and I would simply point out that the Nasdaq 100 (^NDX) still remains above its 200-day EMA. Even if that should break there is a long way down before the March low would be in jeopardy.
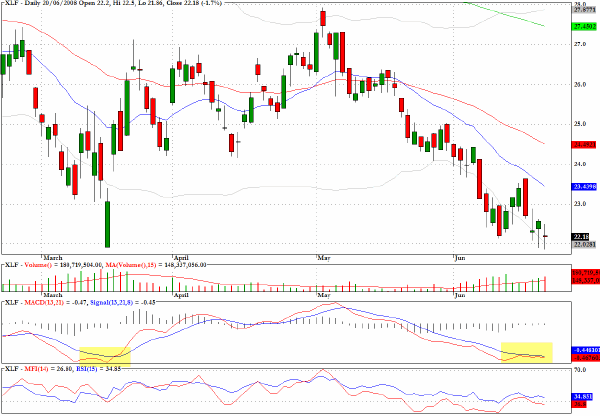
XLF is showing some early stage positive divergences on both the MACD and MFI charts as it has retreated to the March levels.
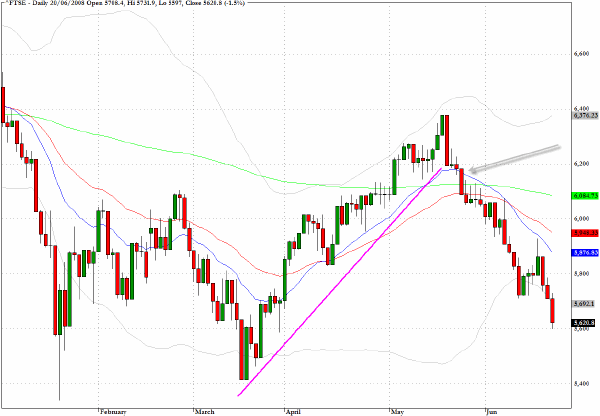
Along with many of the global indices the FTSE index is approaching the mid-March low. What I find quite remarkable about the technical configuration of this index is the clearly symmetrical nature of the steep upward channel from the March low up to the mid-May peak, the clear technical breakdown that has been marked by the arrow on the chart, which took place on May 23, followed by the steep downward channel since. In hindsight, which always enables 20/20 vision, this would have been one of the easiest indices to trade over the last few months.
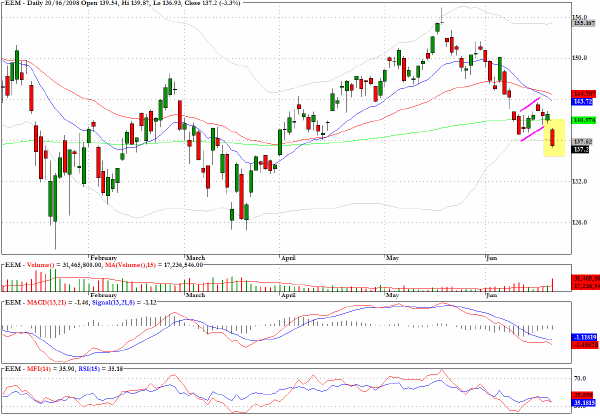
Last week was a very profitable one if you were on the short side, not only in the US market but also in most other world markets where the geographical sector funds provide liquid short instruments for non-institutional investors. The EEM sector fund, discussed here recently, dropped out of a bear flag pattern and finished below a key level in Friday's trading on twice the average daily volume.
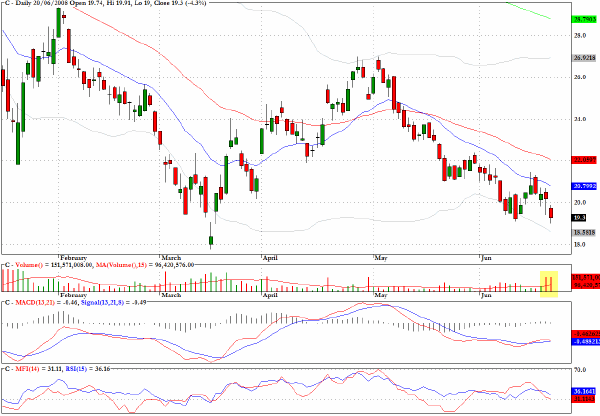
The volume for Citigroup (C) has picked up as it comes back toward a retest of the $18 level seen in March. This is one of the focus stocks for the next few sessions and I shall be watching for any evidence of a capitulation low to be in place for a tradable bounce.
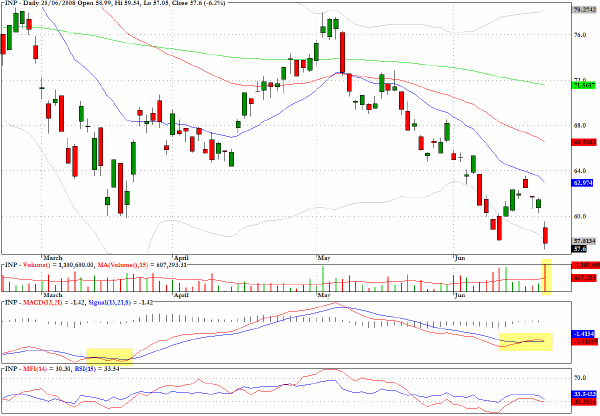
In addition to the testing of critical levels that is taking place in the more established world markets, there have been several critical technical breakdowns in emerging markets, particularly the BRIC zone. The Bombay Sensex closed Monday's session with another drop of almost two percent and is now almost certain to head down to 14,000 where there is some chart support. The INP sector fund provides exposure to the MSCI India index.
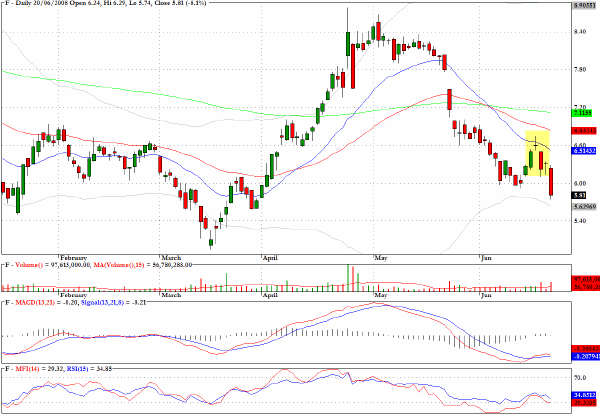
After Ford registered a text book example of the evening star candlestick pattern as highlighted on the chart it was suggested that further downside was to be expected in the intermediate term. We are getting there in more of a hurry than I expected thanks to downgrades by the ratings agencies.
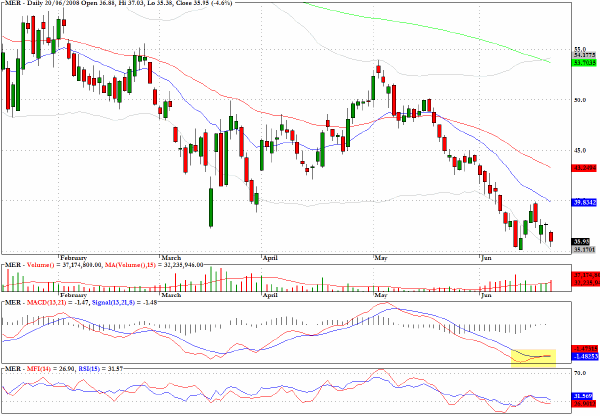
Merrill Lynch (MER) fell almost five percent on Friday and is very close to the low experienced on June 11, which itself was considerably below the March low. The MACD chart appears to be signaling a positive divergence or non-confirmation on the committment behind the selling on Friday, but calling a bottom in the financials has been subject to error before.
Clive Corcoran is the publisher of TradeWithForm.com, which provides daily analysis and commentary on the US stock market. He specializes in market neutral investing and and is currently working on a book about the benefits of trading with long/short strategies, which is scheduled for publication later this year.
Disclaimer
The purpose of this article is to offer you the chance to review the trading methodology, risk reduction strategies and portfolio construction techniques described at tradewithform.com. There is no guarantee that the trading strategies advocated will be profitable. Moreover, there is a risk that following these strategies will lead to loss of capital. Past results are no guarantee of future results. Trading stocks and CFD's can yield large rewards, but also has large potential risks. Trading with leverage can be especially risky. You should be fully aware of the risks of trading in the capital markets. You are strongly advised not to trade with capital.
|