| SPY Looks Oversold On Daily MACD |
| By Price Headley |
Published
06/24/2008
|
Stocks
|
Unrated
|
|
|
|
SPY Looks Oversold On Daily MACD
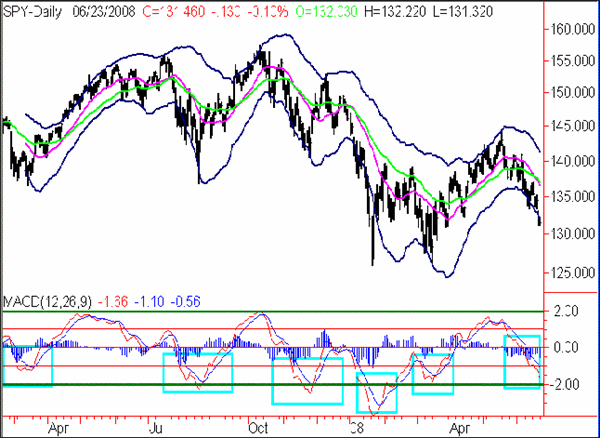
Since the Mid-May top, the S&P 500 Index ETF (SPY) has been on a steady decline. However, one widely followed technical indicator is pointing to a very oversold condition that should result in a short-term bounce in this index.
The simple Moving Average Convergence/Divergence (MACD) trendline is indicated by the red line in the bottom of the following chart. This is based on the 12- and 26-day Moving Average of the SPYs. As you can see, we are nearing a fairly extreme level of -2.00 on this indicator. Over the past year, there have been 5 previous extreme oversold readings around this level. After 4 of these, the SPY rallied in the short-term. In January of this year, the MACD reading did penetrate the -2.00 level, breaking -3.00 before reversing.
SPY Daily Chart with MACD

In addition to the -2.00 MACD reading being significant on the downside, you can see that the +2.00 level has also been resistance on the upside. Over the past year, this indicator has approached this level 3 times, and that either led to a sideways/downward market or a strong selloff each time. So keep an eye peeled if we rally back to that overextended level in the future.
Price Headley is the founder and chief analyst of BigTrends.com.
|