| Corcoran Technical Trading Patterns For June 25 |
| By Clive Corcoran |
Published
06/25/2008
|
Stocks
|
Unrated
|
|
|
|
Corcoran Technical Trading Patterns For June 25
The FOMC decision to be announced later today was yesterday being billed as the most important Fed decision for more than a year but the cynics will say - that's what they say before every one. The highlight from yesterday's session was the fact that the Dow Jones Industrials managed to penetrate on an intraday basis below the mid March low.
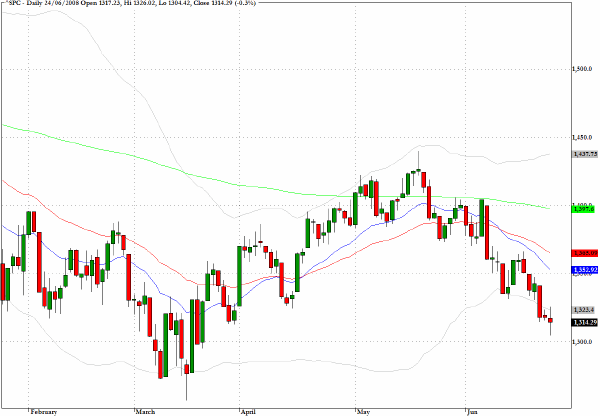
The S&P 500 (^SPC) has further to go as it closed almost 40 points or three percent above its closing low of 1276 from March 17.
From a technical point of view it is difficult to find any obvious targets/support levels where we closed yesterday and the most that I am prepared to say at this juncture is that there should be support around 1270 and clear overhead resistance about 100 points above that at 1370.
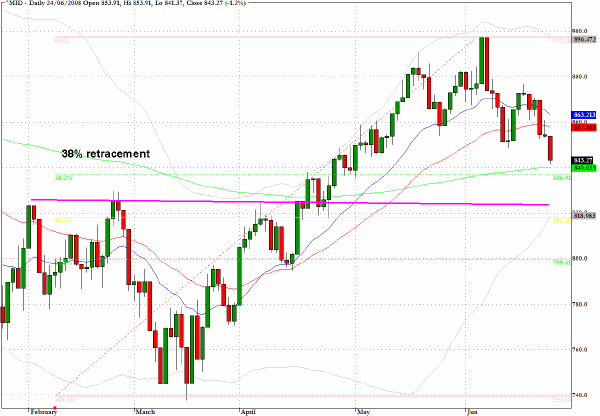
On the S&P 400 Midcap index (^MID) which has been sliding slightly less sharply than the rest of the market there would be a potential bounce at 840 which represents the 38% retracement of the mid-March low and the mid-May high as well as marking the 200-day EMA.
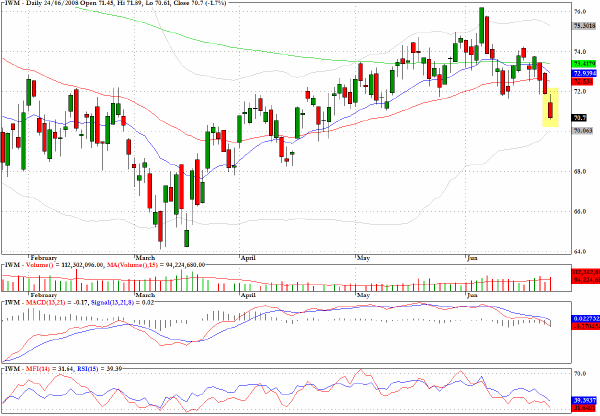
The smaller cap stocks are now showing signs of technical weakness and attrition, and worth monitoring today is evidence that confirms yesterday's pickup in volume on IWM, the exchange traded proxy for the Russell 2000, as the index dropped below key support levels.
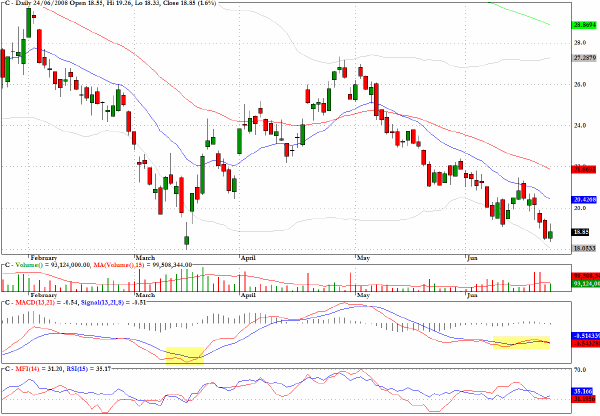
An attempt to mount a rally in the financials yesterday faded as the day wore on. I have included an update on Citigroup (C) not, I hasten to add, because I am suggesting a long position but simply that the technical patterns of stock like this one could provide early clues as to where the market wants to go next.
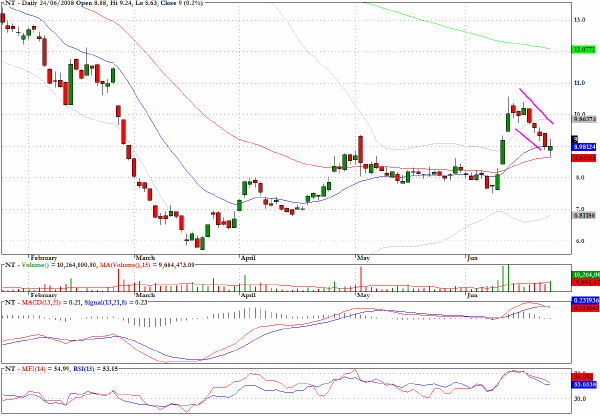
Nortel Networks (NT) has a bull flag pattern.
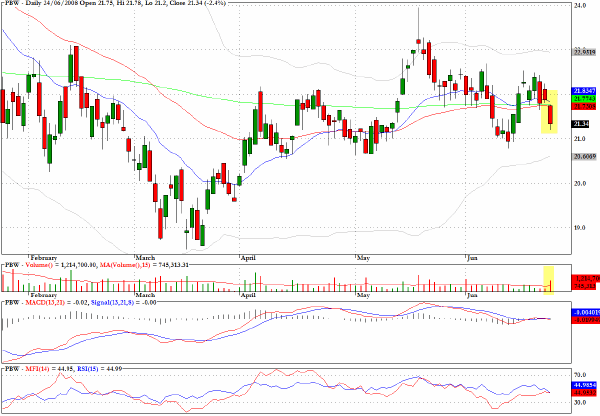
The exchange traded fund for clean energy (PBW) dropped below key levels on at least twice the average daily volume.
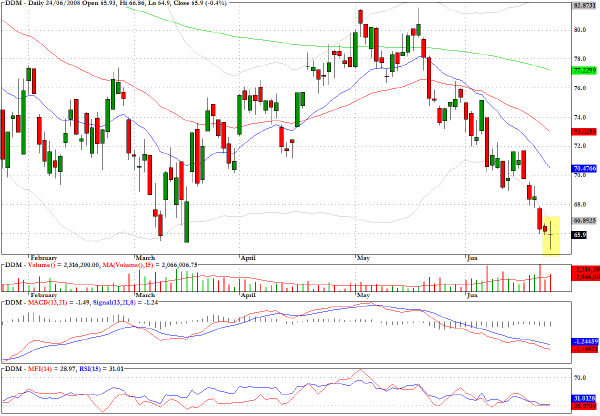
The Ultra Dow 30 fund provides two to one leverage on the upside for the Dow Jones Industrials.
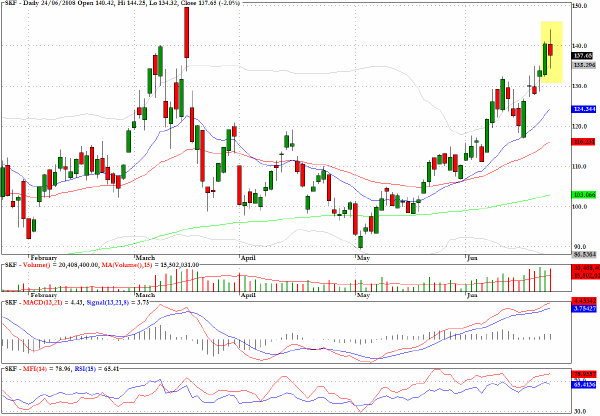
Another exchange traded fund that provides a leveraged exposure to a particular sector is SKF which is an inverse tracker of the financials with two to one leverage. This fund is also available for shorting which provides converse behavior (although not exactly in a symmetrical fashion to a 2:l long version of the fund).
Clive Corcoran is the publisher of TradeWithForm.com, which provides daily analysis and commentary on the US stock market. He specializes in market neutral investing and and is currently working on a book about the benefits of trading with long/short strategies, which is scheduled for publication later this year.
Disclaimer
The purpose of this article is to offer you the chance to review the trading methodology, risk reduction strategies and portfolio construction techniques described at tradewithform.com. There is no guarantee that the trading strategies advocated will be profitable. Moreover, there is a risk that following these strategies will lead to loss of capital. Past results are no guarantee of future results. Trading stocks and CFD's can yield large rewards, but also has large potential risks. Trading with leverage can be especially risky. You should be fully aware of the risks of trading in the capital markets. You are strongly advised not to trade with capital.
|