| Corcoran Technical Trading Patterns For June 26 |
| By Clive Corcoran |
Published
06/26/2008
|
Stocks
|
Unrated
|
|
|
|
Corcoran Technical Trading Patterns For June 26
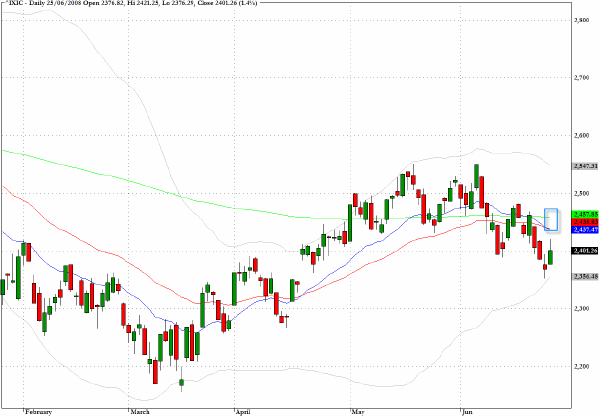
In the aftermath of the meeting of the eminent FOMC committee the statement that accompanied the unsurprising decision not to move rates provided nothing new for the markets. Now they still have to confront the same reality as before which is that, until there is technical evidence to the contrary, rallies back to resistance levels will be seen as opportunities to unload gains from short term long positions or to establish new short positions.
The Nasdaq Composite (^IXIC) will face exactly this challenge in the vicinity indicated on the chart.
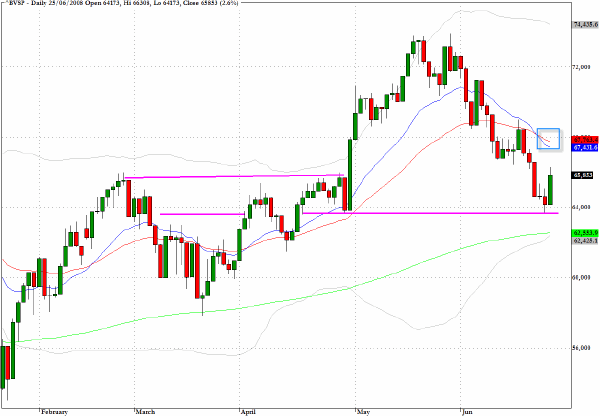
The Brazilian Bovespa index (^BVSP) will also face a major hurdle as it attempts to climb back above the 20 and 50-day EMA's which have almost intersected between 67,000 and 68,000.
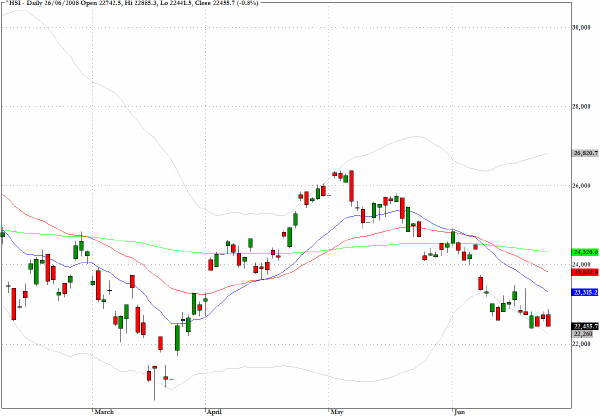
In overnight trading in Asia the performance of the Hang Seng index (^HSI) will not be heartening for those sensing that the Chinese market may be trying to build a base. In the latter part of the trading session the Hang Seng gave back any intraday gains and closed more or less on the low for the day.
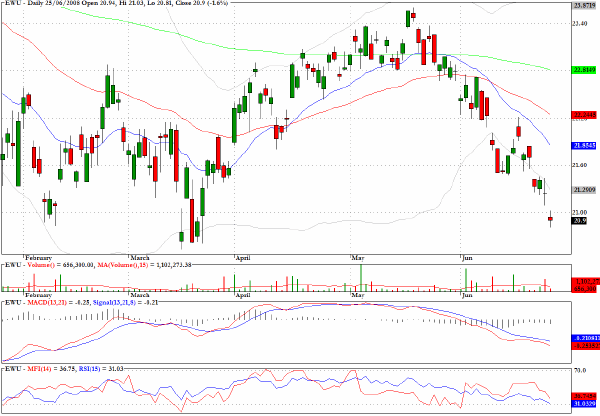
Last week I discussed how the exchange traded sector fund EWU, that reflects the MSCI index for the United Kingdom, could provide the short leg in a pairs trade as against a more favored global market index. The fund has continued down and is now approaching the mid-March low. A recent market analysis pointed out that the FTSE index is in many respects a poor barometer for the UK economy and domestic stocks because of its overweighting in terms of mining and energy-based stocks which have side stepped the malaise that is gathering momentum in the home grown economy. The MSCI index for the UK better reflects the weakness of the domestic market.
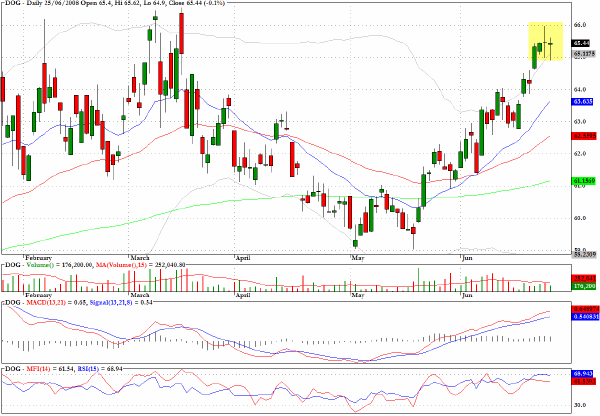
A number of readers of this commentary have expressed interest in the inverse tracker funds that are exchange traded. The fund called DOG tracks the Dow Jones Industrials but moves inversely to the index so the action of the last two sessions is one method of interpreting the likelihood that the DJIA is preparing to rally from current levels.
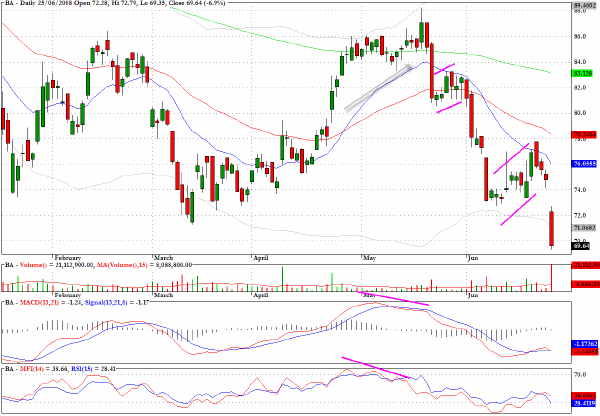
Regular readers may recall the bearish call that I made on Boeing (BA) in early June based on the various technical weakness highlighted on the chart. The pattern has gone on to reveal a further bear flag formation as part of a downward staircase pattern which is something I discuss in some detail in my book Long/Short Market Dynamics.
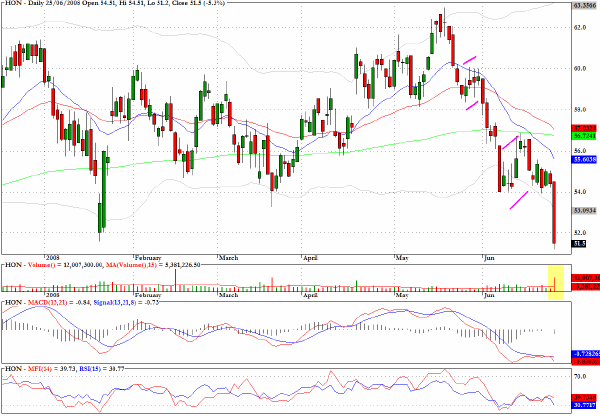
A very similar story to the above could also be told in relation to the Honeywell (HON) chart.
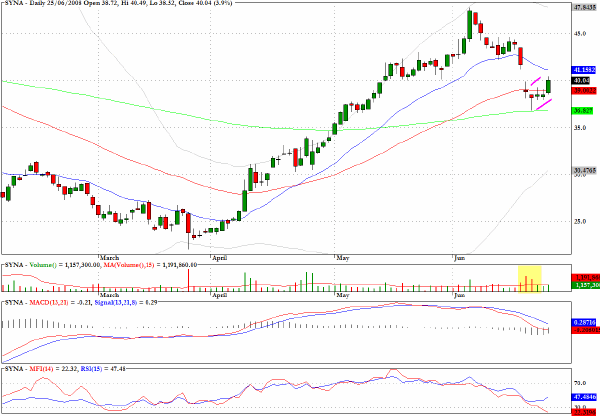
There is probably room for more gains before looking for an entry opportunity but Synpatics (SYNA) appears to be setting up for a breakdown from a bear flag pattern.
Clive Corcoran is the publisher of TradeWithForm.com, which provides daily analysis and commentary on the US stock market. He specializes in market neutral investing and and is currently working on a book about the benefits of trading with long/short strategies, which is scheduled for publication later this year.
Disclaimer
The purpose of this article is to offer you the chance to review the trading methodology, risk reduction strategies and portfolio construction techniques described at tradewithform.com. There is no guarantee that the trading strategies advocated will be profitable. Moreover, there is a risk that following these strategies will lead to loss of capital. Past results are no guarantee of future results. Trading stocks and CFD's can yield large rewards, but also has large potential risks. Trading with leverage can be especially risky. You should be fully aware of the risks of trading in the capital markets. You are strongly advised not to trade with capital.
|