| Corcoran Technical Trading Patterns For June 27 |
| By Clive Corcoran |
Published
06/27/2008
|
Stocks
|
Unrated
|
|
|
|
Corcoran Technical Trading Patterns For June 27
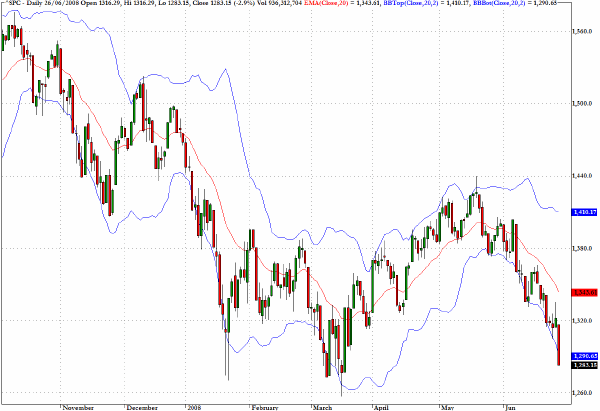
The S&P 500 (^SPC) closed within one percent of the critical March 17 low.
So are we headed for a break down or do we rally?
Without meaning to sound flippant, it would be rather "cute" if the market sold down below the 1270 level in a panic mode and then produced a massive short covering rally to take us eventually back to the 1370-1380 level. At this point almost every man and his neighbor would be looking to ride the next wave down. It really is very hard to call right now as many indications are pointing to a slow motion crash unfolding but still stubborn divergences are occurring beneath the surface, and one senses that the short sellers are having it too easy.
How much lower are we going on the commercial banks?
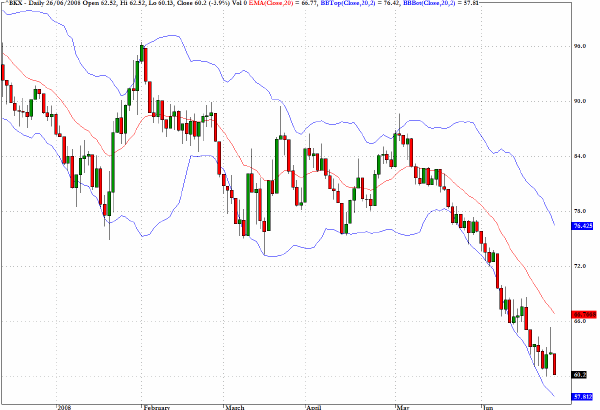
Yesterday we closed at 60 which is a 50% retracement from the historic highs achieved on this index of aproximately 120.
Also interesting is the fact that since breaking down from the triangular or descending wedge pattern, we have covered most of the height of the triangle to the downside.
Are we there yet? A symmetrical breakdown would take us to around 56 which is also close to where the 20-day volatility bands are pointing. So the guarded answer to the question just posed is - No, but we are probably close.
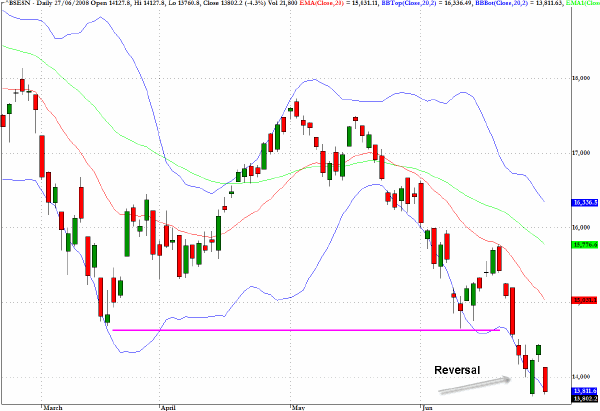
The Bombay Sensex Index(^BSESN), part of the BRIC complex, shows a classic reversal pattern at critical lows but the intraday low today was above the intraday low from Wednesday's session. One is clearly left with the sense that for traders on Monday all will depend on how the US markets perform today.
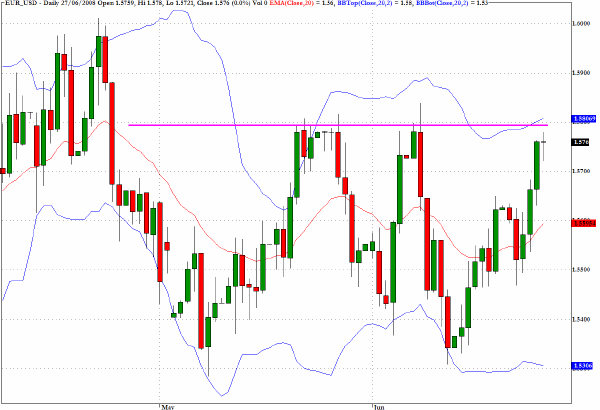
The euro appears to be setting up for an upside breakout above 1.58 on the cross rate with the dollar.
There is a very interesting fractal pattern emerging on the chart which strongly suggests that we could well laying the foundations for a move up and beyond 1.60
From a fundamental perspective there is the ECB decision next week and the market's sense that it has got the Fed on the hook. Forex traders may well make the move that breaks down the equity markets but the previous high of 1.60 is now critical.
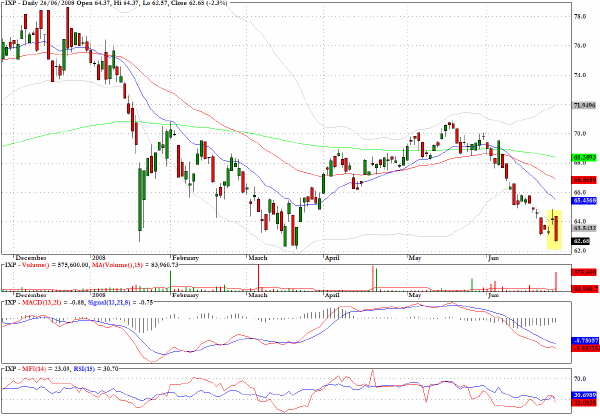
One of the largest proportionate volume moves yesterday was in the sector fund that tracks the S&P Global Telecommunications stocks. The volume was seven times the daily average pointing to fairly decisive action by some asset managers that could be exiting the sector.
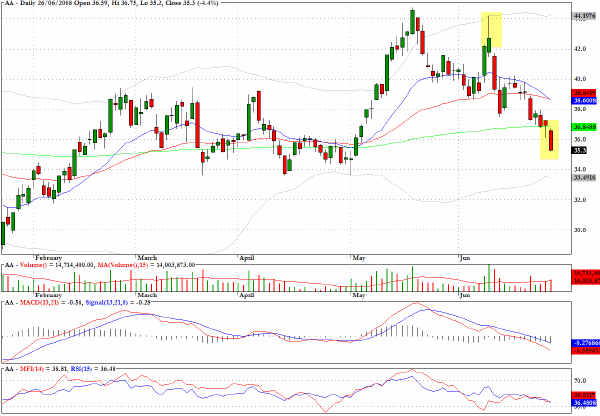
Alcoa (AA) slipped below key moving average support yesterday. Industrial commodities have been moving down in this latest sell-off and the action highlights the significance of the failure candlestick that has been highlighted on the chart.
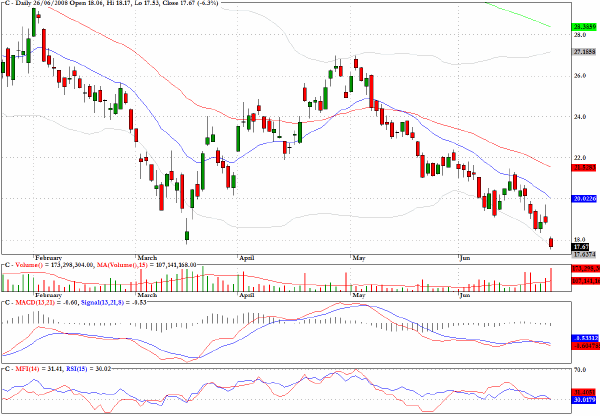
I cannot help feeling that the market calls made by Goldman Sachs recently, including a short sell recommendation on Citigroup (admittedly as part of a pairs trade) are a little disingenuous on the one hand, and rather late in the day on the other. Citigroup (C) is struggling at multi-year lows and although there are certainly major writedowns ahead one has to wonder how much of this is already factored into the price.
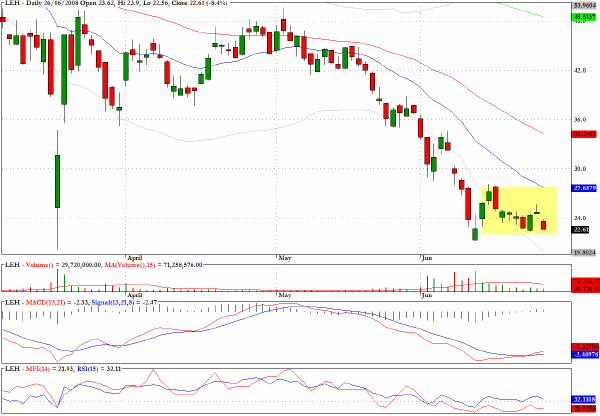
Volume is drying up as Lehman Brothers sinks back towards new multi-year lows. Is this bank going out of business - the bears seem to be betting that it is but they really don't know and would be very quick to cover on any snap back rally.
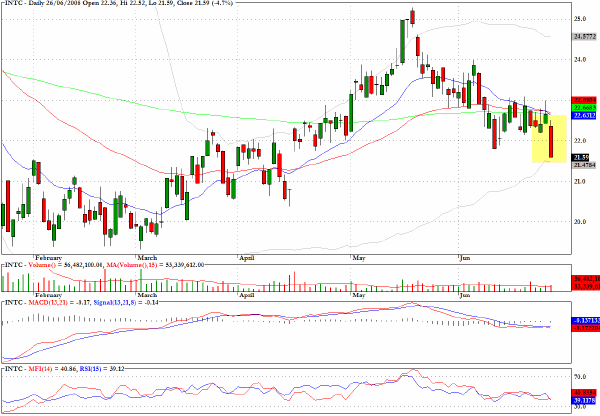
The price action yesterday for Intel (INTC) reveals a breakdown from moving average support but the volume does not yet point to panic selling or capitulation.
Clive Corcoran is the publisher of TradeWithForm.com, which provides daily analysis and commentary on the US stock market. He specializes in market neutral investing and and is currently working on a book about the benefits of trading with long/short strategies, which is scheduled for publication later this year.
Disclaimer
The purpose of this article is to offer you the chance to review the trading methodology, risk reduction strategies and portfolio construction techniques described at tradewithform.com. There is no guarantee that the trading strategies advocated will be profitable. Moreover, there is a risk that following these strategies will lead to loss of capital. Past results are no guarantee of future results. Trading stocks and CFD's can yield large rewards, but also has large potential risks. Trading with leverage can be especially risky. You should be fully aware of the risks of trading in the capital markets. You are strongly advised not to trade with capital.
|