| S&P 500 Pointing Towards Test Of January-March Support Line |
| By Mike Paulenoff |
Published
06/27/2008
|
Stocks
|
Unrated
|
|
|
|
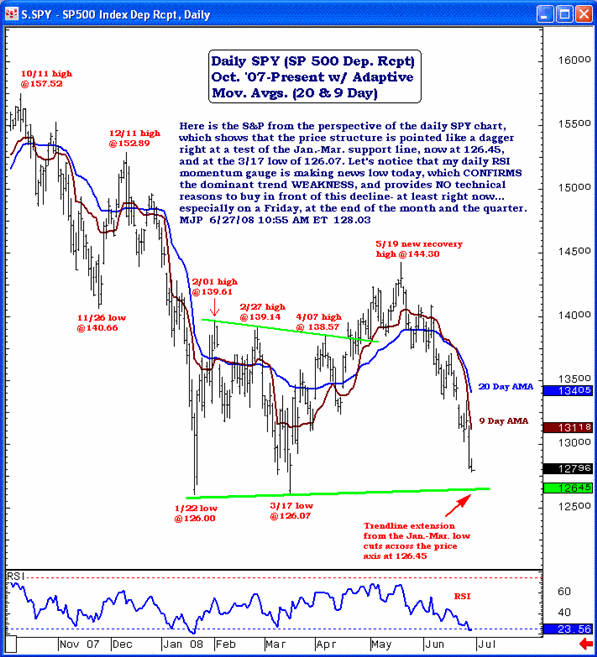
S&P 500 Pointing Towards Test Of January-March Support Line
Here is the S&P 500 from the perspective of the daily S&P 500 Depository Receipt (SPY) chart, which shows that the price structure is pointed like a dagger right at a test of the January-March support line, now at 126.45, and at the March 17 low at 126.07. Let's notice that my daily RSI momentum gauge is making news low today, which confirms the dominant trend weakness, and provides notechnical reasons to buy in front of this decline -- at least right now, especially on a Friday at the end of the month and the quarter.

Mike Paulenoff is a 26-year veteran of the financial markets and author of MPTrader.com, a real-time diary of his technical chart analysis and trading alerts on all major markets. For more of Mike Paulenoff, sign up for a free 15-Day trial to his MPTrader Diary by clicking here.
|