| Not Bearish Enough On The Market |
| By Price Headley |
Published
06/28/2008
|
Currency , Futures , Options , Stocks
|
Unrated
|
|
|
|
Not Bearish Enough On The Market
With the recent onslaught of afternoon sell-offs we've reached the 2008 bottom for the third time. First January, then March, and now June, every three months in 2008 we are seeing the lows tested. Many technical theories believe the third test of any high or low often leads to a breakout or in this case a further breakdown. The sentiment indicators are supportive of at least a few m ore days of downside action. Of course, a reversal can start today, but it's not likely given the amount of complacency in the market. Keep reading to see why we need more fear and panic to define the true bottom.
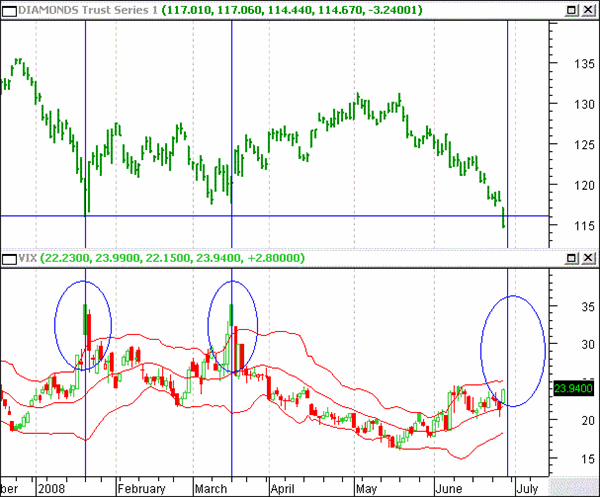
Fear spikes are best quantified by the Volatility index (VIX) and those relative highs can be measured by Bollinger Bands. That is, any close outside the Bollinger bands may signify an extreme, which can also signify a reversal. The chart below shows the fear and panic that occurred prior to a sustainable reversal. The clearly defined peaks in fear are marked with blue circles, which accompany a market rebound or reversal. The major cause for concern here is the lack of fear in the VIX, it is rare that we see a meaningful reversal without being pushed towards the market limits.
CBOE Volatility Index

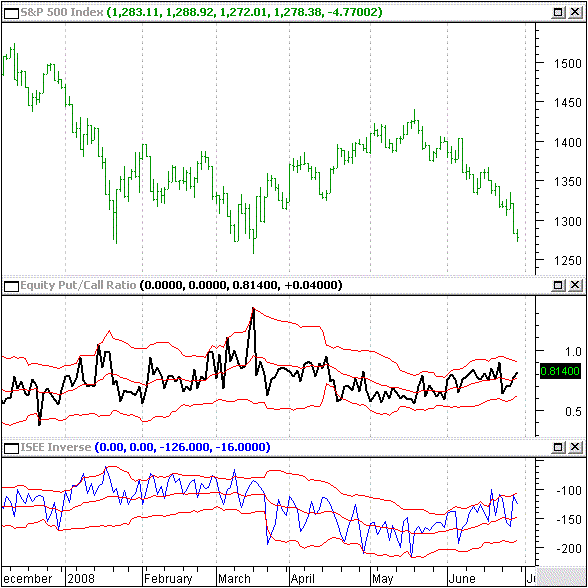
Aside from fear spikes, complacency is the other key sentiment to watch. The CBOE Equity Put/Call Ratio (EPCR) is a great way to measure market participants' sentiment. As contrarians, we evolve between bullish and bearish outlooks by going against the common belief. By looking at the number of equity puts versus equity calls we can determine the effective bullish or bearish sentiment in the market. When that sentiment reached an unhealthy extreme it is likely that a reversal will occur. Conversely, if market sentiment does not reach an extreme the current trend is likely to continue. In the chart below, you can see the previous two market bottoms were market by spikes in market bearishness, participants were too bearish. This shows that market participants have not become bearish enough, we may need another major sell-off (or more) to reach these levels.
CBOE Equity Put/Call Ratio

Traditionally, we measure fear extremes relative to the market environment using Bollinger Bands. These levels are adjusting daily with the market. We would like to see the VIX close above 25 for two consecutive days to signal a reversal point, while the EPCR needs a spike above 90% (last reversal signal was 135%!). Given the amount of chart we need to cover for the VIX and EPCR downside action may continue for several days.
Price Headley is the founder and chief analyst of BigTrends.com.
|