| Corcoran Technical Trading Patterns For June 30 |
| By Clive Corcoran |
Published
06/30/2008
|
Stocks
|
Unrated
|
|
|
|
Corcoran Technical Trading Patterns For June 30
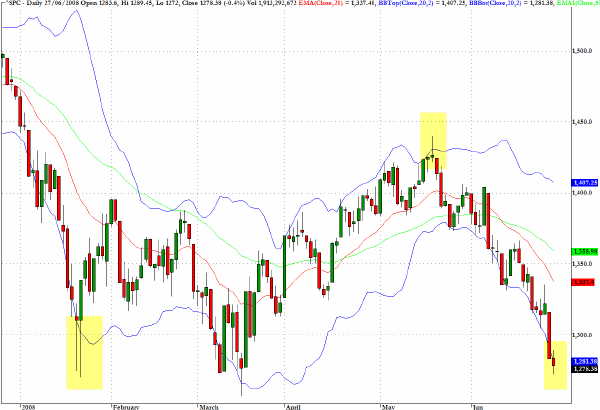
In Friday's commentary and when interviewed on CNBC's European Closing Bell that afternoon I alluded to the nature of the orderly decline across the US equity indices. This gradual and methodical fall is what is creating the impression that we are witnessing a slow motion crash The chart below for the S&P 500 (^SPC) shows the 20-day volatility bands constructed at two standard deviations either side of the 20-day EMA. In essence the price action going back to late last year shows a persistent rather than exceptional rise and decline in the context of inter-day volatility.
There has been enhanced intraday volatility but across the end of day time frame the recent sell-off has been statistically well behaved. The one exception to this, which, perhaps, tends to underline the rule, was the extreme behavior that occurred in late January and which occasioned the Fed's first major rate cuts. Extreme reactions (i.e. those that lie outside the 95% level of probability implied by the two standard deviations channel) are seen at major bear market bottoms and the fact that we have not seen one yet suggests that we still have some way to go yet. This is not to suggest that we are about to see a major crash episode, in fact I favor the view that we get another short term rally before we see the real base of this bear market.
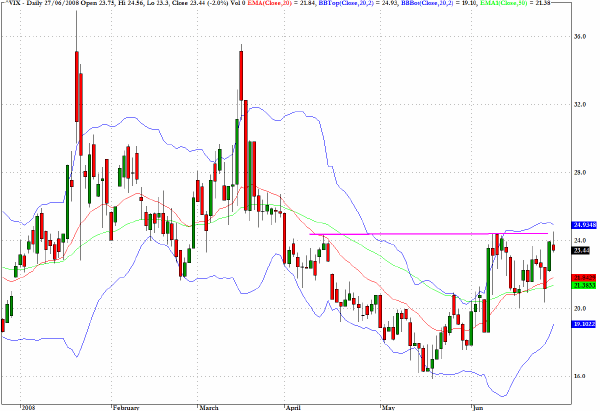
The behavior of the CBOE Volatility Index (^VIX) supports the hypothesis that I was developing above in relation to the actual price behavior of the S&P 500. There were severe spikes in January and March but most recently during the June decline the actual variability of implied volatility also suggests that the sell-off should best be seen as orderly and a component of inter-market long/short strategies with a bearish equity leg rather than a panic stricken mass exodus from the long side.
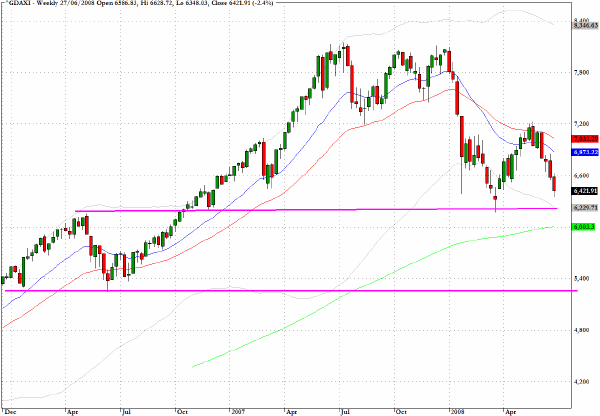
Looking at a weekly time frame Germany's Dax index (^GDAXI) seems set to have a rendezvous with the 6200 level before a stable base could be built for an intermediate term rally. Not that I am forecasting this but the 5300 area also could become a target on the longer term horizon.
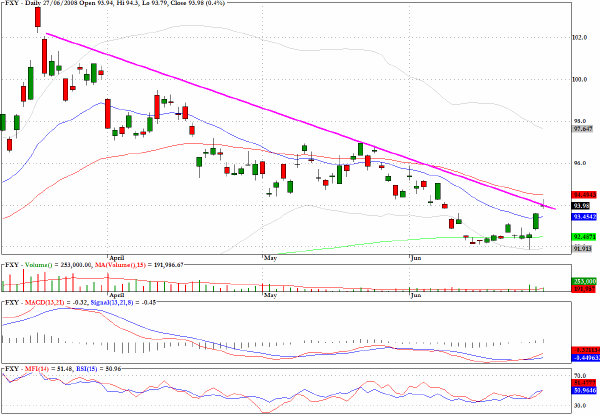
The forex markets look set to have a very interesting week with the ECB rate decision and a possible challenge by the euro of the $1.60 level. Also worth monitoring this week is the Japanese yen which is continuing to show strength in most of the more closely followed cross rates. Against the US dollar the chart below shows that the Japanese currency could be ready to break above a long term downtrend. If this is sustainable this could also add further disruption to global capital flows.
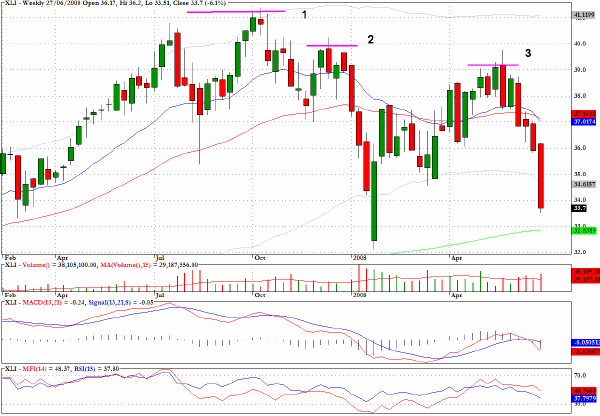
A sector fund that tracks the industrial and manufacturing sector, XLI, is showing evidence of capital exodus and distribution. The three levels indicated on the weekly chart show a succession of lower highs and last week's loss of more than six percent came on an increase in volume. Some support could kick in at the 200-week EMA but overall the complexion of the sector is becoming bearish.
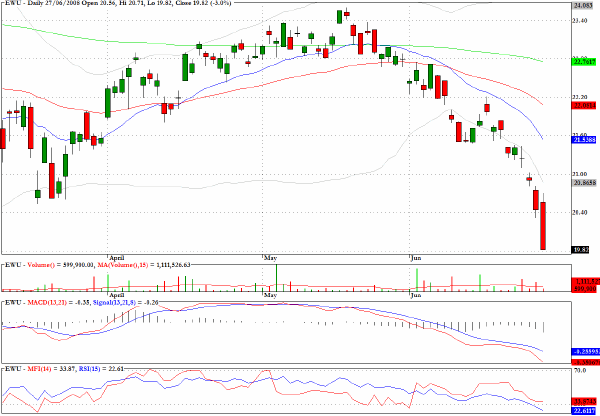
EWU, which tracks the performance of the MSCI UK index, and which was discussed here a couple of times last week would have produced a good return on the short side throughout last week and especially in Friday's session.
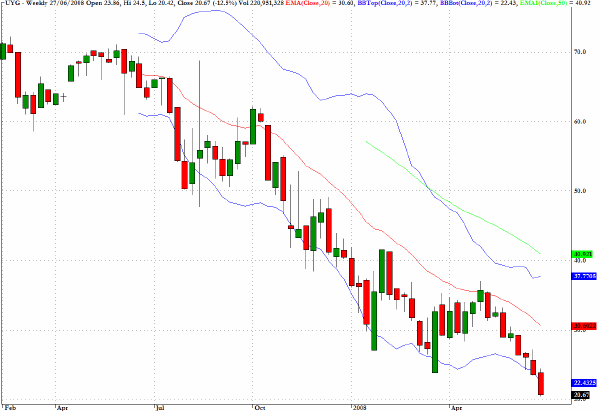
UYG is a 2:1 leveraged tracker for the financials and allows one to benefit more aggressively from any rebound in the sector. Once again I would point to the price behavior within the volatility channel to underline the fact that the decline has been persistent and orderly rather than chaotic and panic driven. As already suggested it may require a more cataclysmic episode before there is a sustainable base for the financials and the overall equity market.
Clive Corcoran is the publisher of TradeWithForm.com, which provides daily analysis and commentary on the US stock market. He specializes in market neutral investing and and is currently working on a book about the benefits of trading with long/short strategies, which is scheduled for publication later this year.
Disclaimer
The purpose of this article is to offer you the chance to review the trading methodology, risk reduction strategies and portfolio construction techniques described at tradewithform.com. There is no guarantee that the trading strategies advocated will be profitable. Moreover, there is a risk that following these strategies will lead to loss of capital. Past results are no guarantee of future results. Trading stocks and CFD's can yield large rewards, but also has large potential risks. Trading with leverage can be especially risky. You should be fully aware of the risks of trading in the capital markets. You are strongly advised not to trade with capital.
|