| Weekly Outlook In The Stock Market |
| By Price Headley |
Published
06/30/2008
|
Stocks
|
Unrated
|
|
|
|
Weekly Outlook In The Stock Market
NASDAQ Composite
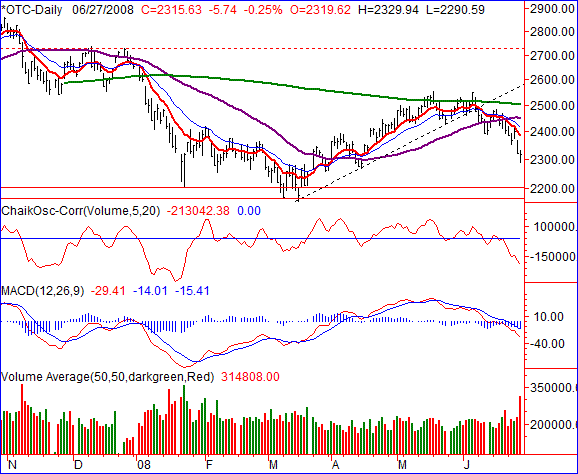
Friday's 0.25% loss (-5.74 points) for the NASDAQ left it at 2315.63. For the week, it fell 3.76% (-90.46 points). Momentum-wise it's bearish, but once again we saw the market fall so quickly and so violently, we've likely set up a dead cat bounce.
In the bigger picture, don't think for a minute that things can't get worse before they get better. Though the NASDAQ has handed us a big loss over the last month, the one we suffered in January was still bigger. And as you can see, the composite hasn't even come close to retesting prior support levels (around 2200).
In the meantime though - and as we mentioned with the other indices below - last week was so bad that it may have set up a slight rebound this coming week. Friday's volume spike may also be a pivot. As long as the 10 day moving average line (red) remains a ceiling though, any upward move should be short lived, quickly replaced by more selling.
NASDAQ Composite Chart - Daily

S&P 500
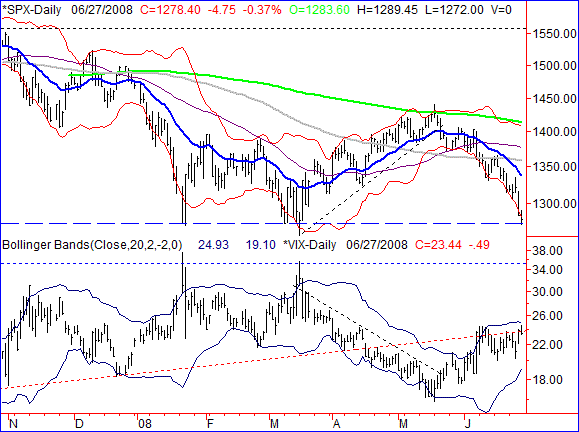
The close of 1278.40 on Friday was 4.75 points lower (-0.37%) than Thursday's. It was also 39.55 points (-3.0%) below the previous weekly close. The S&P 500 is approaching new lows for the year....and new 52-week lows for that matter. Last week was so harsh though, that we may not see the SPX do the deed straight-away.
Though the S&P 500 isn't yet at new lows, it's darn close. Keep an eye on 1270 or so; this is the third time the S&P 500 has tested it as support. For the bears, the third time may indeed be the charm.
Amazingly, the VIX hasn't moved any higher than it was three weeks ago, though the market has gotten beaten up quite a bit. Where's the fear? That's the point - there is none. That's why it's hard to believe we've actually hit a bottom yet.
On that note, it is worth pointing out the VIX is hitting resistance at a line that used to be support (red, dashed).
Maybe we are on track to see the VIX head lower and also see stocks pop. Don't count on either moving that direction for very long though. The VIX's lower band is on the rise, and the SPX has found plenty of resistance this year.
S&P 500 Chart - Daily

Dow Jones Industrials
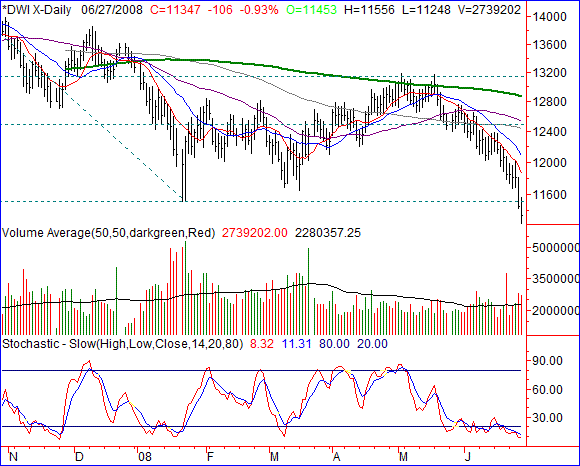
The 106 point loss (-0.93%) on Friday for the Dow was the biggest of all the indices. The 496 point dip (-4.19%) for the week was also the heftiest pullback of all the indices. Oh, did we mention the Dow also hit new 52-week lows? That will certainly make it easier to sink lower, and drag the other indices down with it. HOWEVER, we're looking for a very short-term rebound following last week's plunge.
Take a look at the stochastic chart; we're as oversold as we've been in a long time. The market hasn't let that condition last very long in recent months.
Now take a look at Thursday and Friday's bar. The 10-day moving average line (red) had been a guidepost, On Thursday and Friday though, the Dow ran away from it. We're basically looking for a retest of the 10-day line, not unlike the reversal we saw back in January. (Note that reversal didn't really go anywhere.)
As long as the 20-day line (blue) holds up as resistance we suspect the bears will remain in control. Just be prepared or a choppy ride.
Dow Jones Industrials Chart - Daily

Price Headley is the founder and chief analyst of BigTrends.com.
|