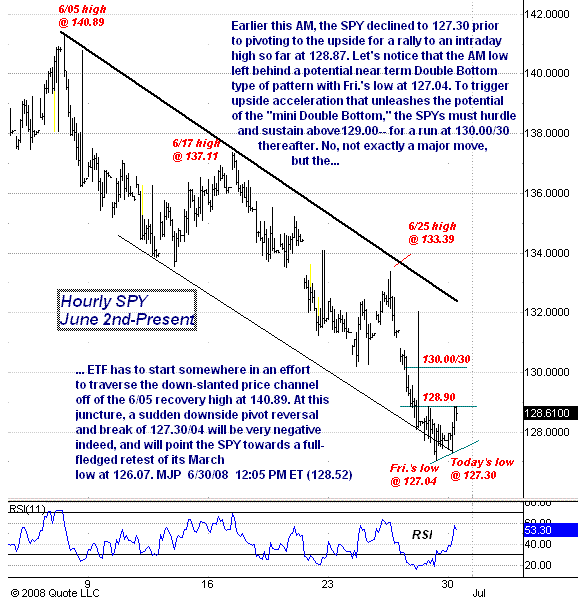
| Potential Near-Term Double Bottom In S&P 500 (SPY) |
| By Mike Paulenoff |
Published
06/30/2008
|
Stocks
|
Unrated
|
|
|
|
Potential Near-Term Double Bottom In S&P 500 (SPY)
Earlier this morning, the SPY declined to 127.30 prior to pivoting to the upside for a rally to an intraday high so far at 128.87. Let's notice that the morning low left behind a potential near term Double Bottom type of pattern with Friday's low at 127.04. To trigger upside acceleration that unleashes the potential of the "mini Double Bottom," the SPYs must hurdle and sustain above 129.00 for a run at 130.00/30 thereafter. No, not exactly a major move, but the ETF has to start somewhere in an effort to traverse the down-slanted price channel off of the June 5 recovery high at 140.89. At this juncture, a sudden downside pivot reversal and break of 127.30/04 will be very negative indeed, and will point the SPY towards a full- fledged retest of its March low at 126.07.

Mike Paulenoff is a 26-year veteran of the financial markets and author of MPTrader.com, a real-time diary of his technical chart analysis and trading alerts on all major markets. For more of Mike Paulenoff, sign up for a free 15-Day trial to his MPTrader Diary by clicking here.
|