| Corcoran Technical Trading Patterns For July 1 |
| By Clive Corcoran |
Published
07/1/2008
|
Stocks
|
Unrated
|
|
|
|
Corcoran Technical Trading Patterns For July 1
The end of the first half of the year brought evidence of window dressing by fund managers with a lot of out of favor stocks being cast aside to save awkward questions for fund managers. The major indices covered quite a bit of ground and finished with diverging performances with the Nasdaq showing relative under-performance again.
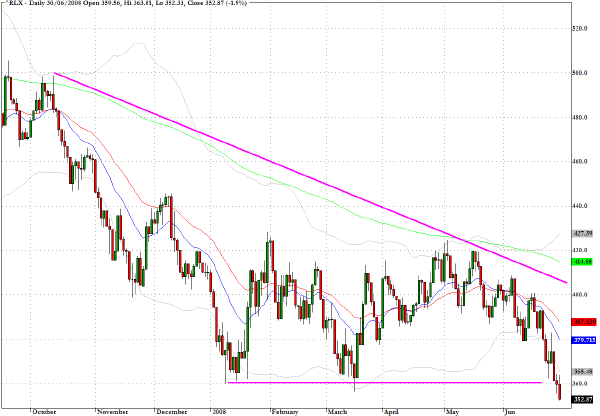
The S&P 500 Retail Index (^RLX) had a very weak session and is now revealing the kind of behavior which is often seen after a breakdown from a descending wedge formation.
As this commentary is being written the European markets are experiencing a sharp sell-off with both UK's FTSE and Germany's Dax down more than two percent. A backdrop to today's trading is the Euro's assault on the 1.58 level and dollar weakness against the yen. In view of the July 4th holiday and the ECB decision on Thursday the latter part of this week could see sharp moves in the forex market in relatively less liquid markets because of the US holiday.
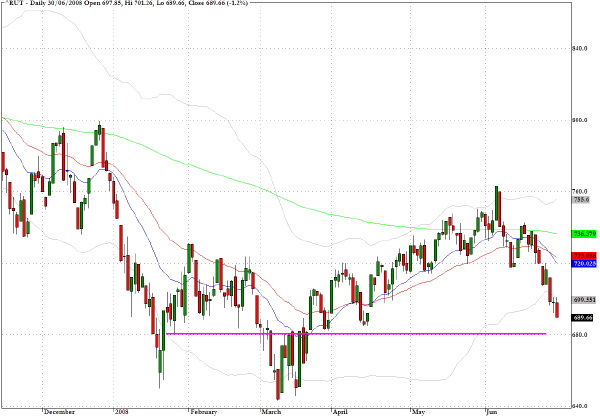
The Russell 2000 (^RUT) has steadily eroded from the more prominent positive divergences with the large cap indices. Of three key indices, the Nasdaq 100, S&P 500 and the Russell 2000 it is the small cap that is still showing the most relative strength in its performance since the beginning of 2008.
If we simply take the period since the mid-March low the Russell 2000 is showing approximately a positive five percent gain, the Nasdaq 100 has in the same period an almost eight percent gain while the S&P 500 is down by one percent.
The index remains above a major support level at 680 but realistically it would seem that along with the other indices traders will be targeting lower levels in line with the mid March low.
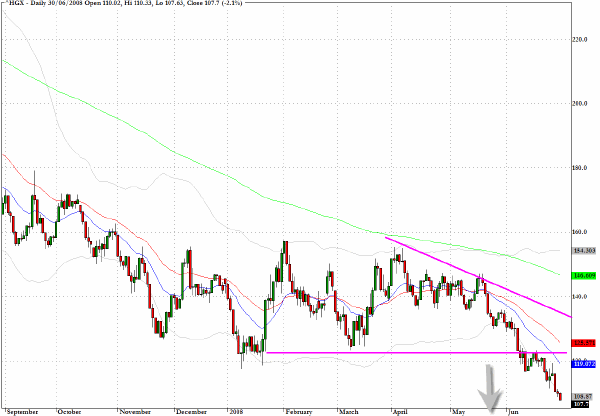
Another symptom of cosmetic position squaring for the end of the quarter was seen in the weakness of the Housing Index (^HGX) which also reveals the pattern discussed above in connection with the retailing index.
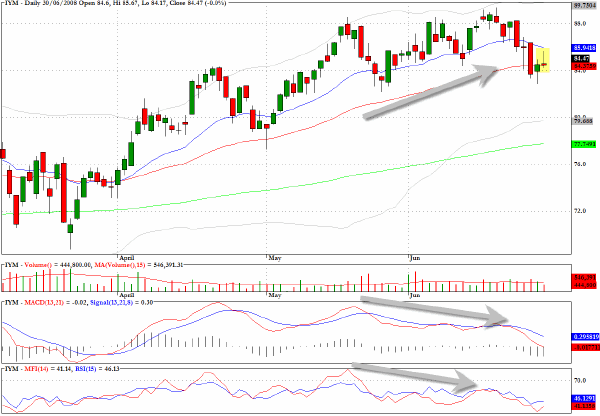
Yesterday, I drew attention to the technical weakness in the XLI fund for the Industrials sector. Another ETF which provides for somewhat related exposure is IYM, reflecting the performance of the Dow Jones Basic Materials sector, and the technical characteristics of this fund reinforce the bearish diagnosis given for that sector.
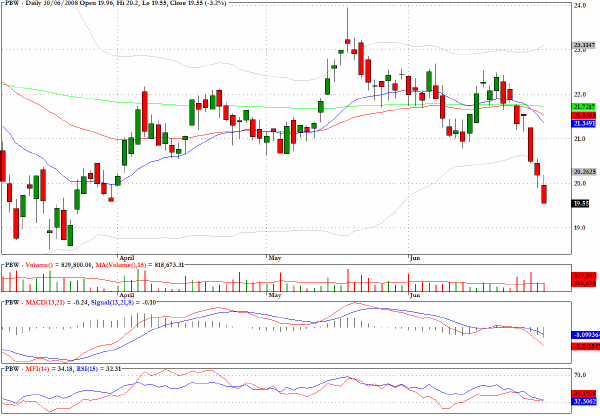
Mentioned here last week the exchange traded fund for clean energy (PBW) has continued its descent.
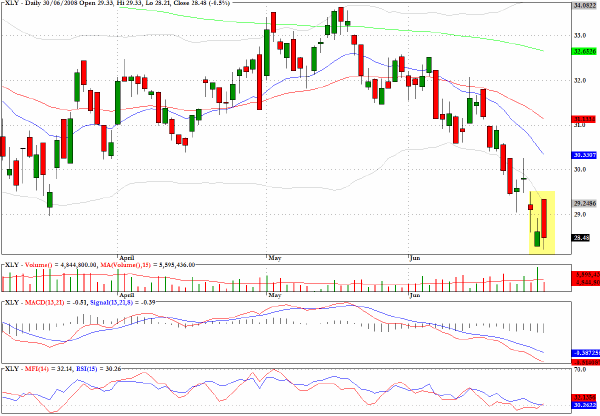
XLY, which represents the consumer discretionary sector, showed a disappointing reversal yesterday as an early gap upwards was faded throughout the session and the fund ended up below Friday's close and near to the session lows.
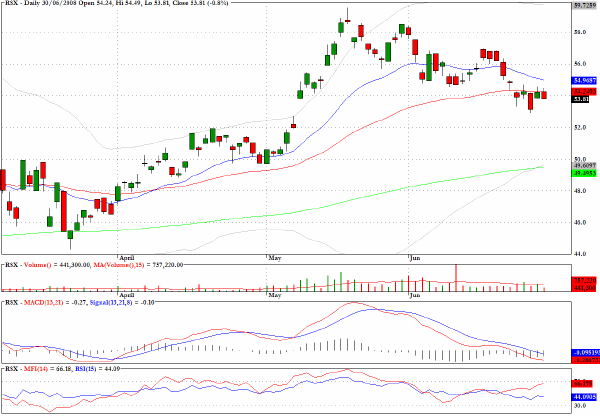
I have begun more extensive coverage of some of the East European and Russian indices. One fund that allows exposure to the Russian index which has been a relative haven for the long side is RSX. The corrective pattern that is evident suggests that this index is having difficulty remaining in contention with the 50-day EMA.
Clive Corcoran is the publisher of TradeWithForm.com, which provides daily analysis and commentary on the US stock market. He specializes in market neutral investing and and is currently working on a book about the benefits of trading with long/short strategies, which is scheduled for publication later this year.
Disclaimer
The purpose of this article is to offer you the chance to review the trading methodology, risk reduction strategies and portfolio construction techniques described at tradewithform.com. There is no guarantee that the trading strategies advocated will be profitable. Moreover, there is a risk that following these strategies will lead to loss of capital. Past results are no guarantee of future results. Trading stocks and CFD's can yield large rewards, but also has large potential risks. Trading with leverage can be especially risky. You should be fully aware of the risks of trading in the capital markets. You are strongly advised not to trade with capital.
|