With the expansion phase of the economic cycle now more than fully developed, and with constricting interest rate hikes rumored to be slowing down, it's no surprise to see some activity and divergence within the financial sector. Some of these stocks are the most sensitive to interest rate fluctuations, while others are the most sensitive to the health of the stock market (and investor confidence). We'll take a look at the financials as a whole, and then break it down into its individual pieces - because they're not all birds of the same feather.
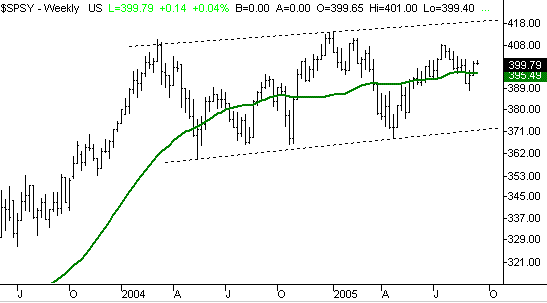
First, let's take a broad look at the entire financial sector. We'll be charting the S&P 500 Financial Sector Index (SPSY), but most of the sector indexes here look the same. In a nutshell, this sector has been range-bound since early 2004, trapped under 413, but held above 365. The current reading of 399.9 is obviously closer to the top of that range than the bottom, which is generally bullish. More than that though, this index also recently crossed back above the 200 day moving average, which serves as a long-term buy signal. On the other hand, the last few times we crossed the 200 day line here, there wasn't too much movement (in either direction). All the same, the rising chart, and the fact that the trading range is pointed slightly upward, suggests that at the very least the financials are a relatively safe place for a piece of your portfolio.
It's not a target, but we do expect to see some resistance around 419 - the upper edge of the channel. We're also placing support (and stops) at 395, where the 200 day line is.
S&P 500 Financial Sector Index (SPSY) - Weekly

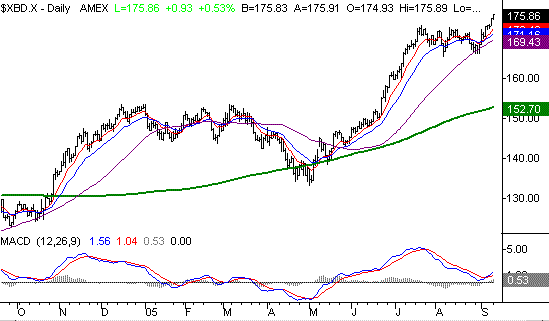
The broker-dealers have been a hot spot within the financial sector. The AMEX Securities Broker-Dealer Index (XBD) appears below, and it's clear from this graph that these stocks are capable of putting up some big numbers. You may recall a few weeks ago, when we highlighted the financials, that we were hesitant to buy into a group that had made such a strong run; the risk of a pullback was too great if the industry cooled off. Well, these stocks cooled off, but didn't really pull back. Instead, they consolidated, or moved sideways between 166 and 172 for a few weeks. This gave investors a chance to catch their breath, and take profits if they wanted to. The thing is, they didn't want to. This consolidation period also gave the moving averages a chance to 'catch up' with the chart. The index fell under the 50 day line (purple) for a few days, and then made the runup you currently see. It's still itching to go higher.....a lot higher. Isn't this index still a little too far away from the 200 day line for the rally to continue? Under normal circumstance, we'd say yes. However, what you don't see on the chart below is 1997, 1999, and 2003. There were periods in those years when these stocks didn't even come close to looking back at the 200 day line. We're not saying this instance will turn out the same, but we are saying that these stocks have a history of bullishly doing the unlikely.
We're setting a target of 202 for the Securities Broker-Dealer Index, and stops on this bullish bias would come with a weekly close (the close on a Friday) under the 50 day line, currently at 169.
AMEX Securities Broker-Dealer Index (XBD) - Daily

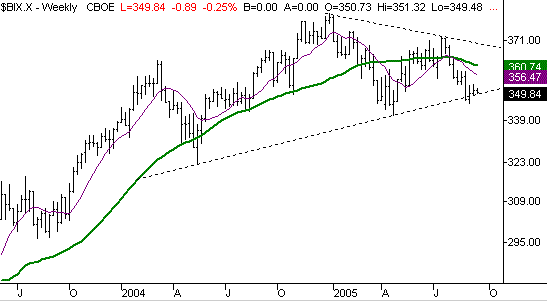
The banks, on the other hand, seem to be headed the other direction. While it's a myth (or at least an unproven idea) that rising interest rates hinder bank profitability, it doesn't that mean investors are willing to test the notion. With interest rates now approaching normal levels, we can see how the banks have fallen out of favor. The S&P Banking Index (BIX) fell under a long-term support line just a few weeks ago. And even though it's above that line now, it's still pointed lower. We've also seen a lower low, meaning the December peak wasn't rivaled by July's peak.
You could do worse than a bank stock, but in most cases, you could also do a lot better.
S&P Banking Index (BIX) - Weekly

Price Headley is the founder and chief analyst of BigTrends.com.