| Where Are the Broader Markets Heading? |
| By Price Headley |
Published
07/3/2008
|
Stocks
|
Unrated
|
|
|
|
Where Are the Broader Markets Heading?
Amid the recent doldrums from both the technical and fundamental sides, I wanted to examine what are some likely areas of downside support should the market selloff continue.
S&P 500 Index
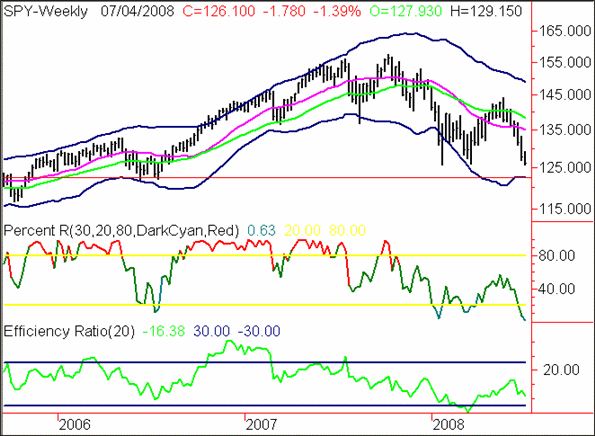
Barring a very strong upmove into the close today, the S&P 500 Index will close below the key 1275 level for the first time since 2006. I now view the area around 1225 as the next downside support level. As you can see on the SPY chart below, the red horizontal line shows around 1225 as the mid-2006 support lows and also as the site of the bottom weekly Acceleration Band. That is about 3% below current levels.
If the correction continues to accelerate, beyond 1225, I would see support much further down, around the 1100 level. That would take us to 2004 levels, and be around another 13% decline in the SPY.
S&P 500 Index (SPY)

NASDAQ 100 Index
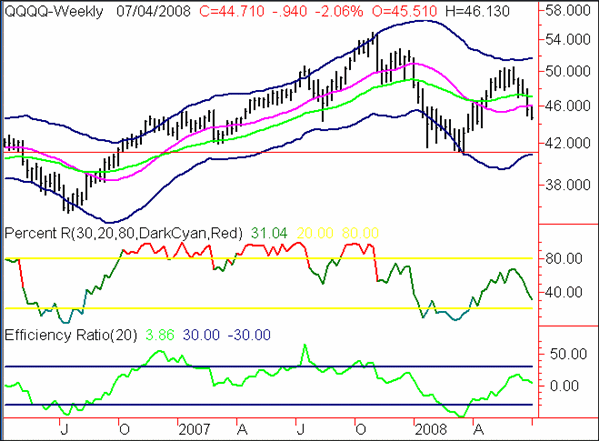
The NASDAQ 100 Index (QQQQ) has held up much better than the S&P and DJIA - but still appears to be correcting. Because this index has dropped less than the others, I see a bigger potential drop to the first strong support level. Around 41 on the QQQQ is the site of the recent low, and the bottom Acceleration Band (red horizontal line in chart below). That would be around a 9% decline from current levels.
NASDAQ 100 Index (QQQQ)

CBOE Volatility Index
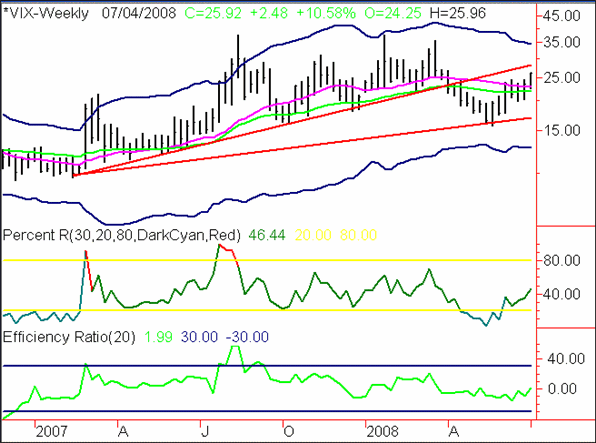
Many market technicians and contrarians are waiting for a panic spike in the CBOE Volatility Index (VIX), to signal that a fear bottom is here, and the market can then rally over the short/medium-term. Many are anticipating a one day spike on the VIX to above 30 to begin this panic reversal -- this may in fact happen, but when many people are expecting something in the market, it often will cross them up.
I see a secondary uptrend in the VIX that goes back to the early-2007 breakout) depicted by the 2 red lines). The first uptrend was broken in April of this year, and a secondary low was reached. By my analysis, I see the former support line as the new resistance line, which may cap the VIX move. This trendline is currently in the 28 range on the upside, with downside support around 17. With the VIX currently just below 25, we are definitely near the top of this range - however as you can see, it is an uptrending range.
CBOE Volatility Index (VIX)

Price Headley is the founder and chief analyst of BigTrends.com.
|