| Corcoran Technical Trading Patterns For July 7 |
| By Clive Corcoran |
Published
07/7/2008
|
Stocks
|
Unrated
|
|
|
|
Corcoran Technical Trading Patterns For July 7
Since Thursday's shortened session the Asian markets have recorded two sessions and the current one which is concluding as this is being written is showing some buying interest with the Nikkei up by about one percent and the Hang Seng index up about 500 points.
Friday's action in Europe was far from plain sailing, however the lows registered last Thursday appeared to underpin the market and confine the latter day sell-off. In Monday's trading the European markets have pulled ahead by more than one percent in early trading.
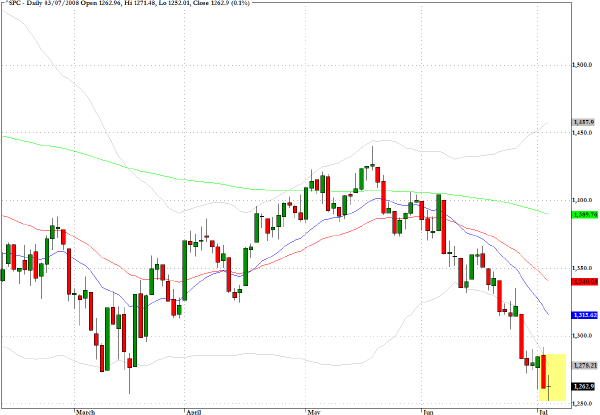
The S&P 500 (^SPC) registered a doji star formation last Thursday with the open and closing price straddling the 1262 level. As the week develops we will see whether the short side decides to book some gains and my sense is that odds of a short term trend reversal are quite high.
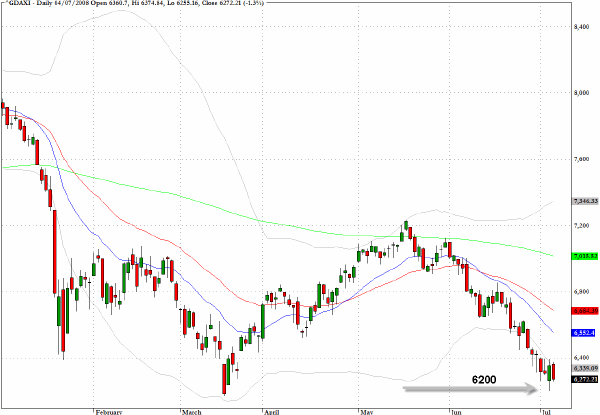
A week ago in this commentary the following opinion was offered - Looking at a weekly time frame Germany’s Dax index (^GDAXI) seems set to have a rendezvous with the 6200 level before a stable base could be built for an intermediate term rally.
Sometimes targets are hit exactly - the intraday low last Thursday was exactly 6200. My intuition is that we may now have a foundation for a rally but I should also remind readers that there is also a distinct possibility that this index could, following a bear market rally, have to face down the 5300 level in the longer term.
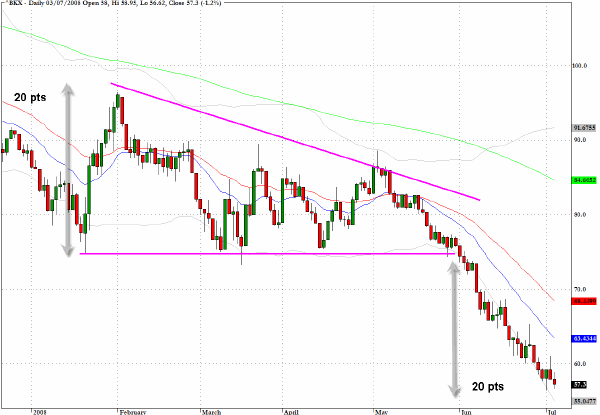
The banking index (^BKX) continues to reveal the slow motion crash symptoms that I have discussed several times. Last week the index came close to the 56 level which I had mentioned as completing the symmetry of the height of the wedge drawn on the chart. I want to to emphasize that I do not have a sufficient catalog of instances of this pattern and have not back tested the symmetrical outcome hypothesis so at this point this equality in the movement is nothing more than an interesting observation.
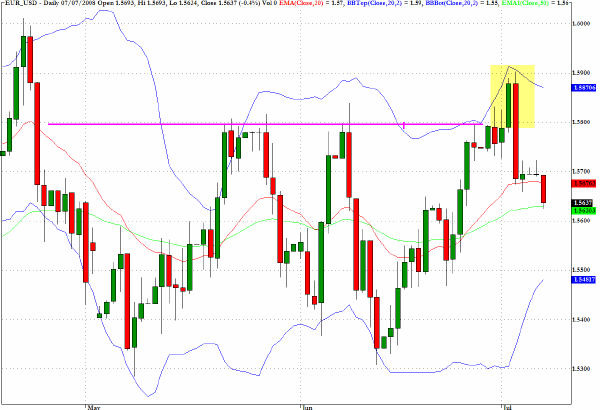
Last weekend the potential challenge of the $1.60 on the Euro/USD seemed to be a focal point for traders. As can be seen in the highlighted section of the chart, the 1.58 resistance level was broken just prior to the ECB decision but since then traders have given back the gains and the exchange rate is now meandering in the middle of the range. Euro bulls/dollar bears lost a round after Trichet's more conciliatory comments accompanying the decision but the Fed remains in an awkward box which suggests that the battle for higher prices is not over.
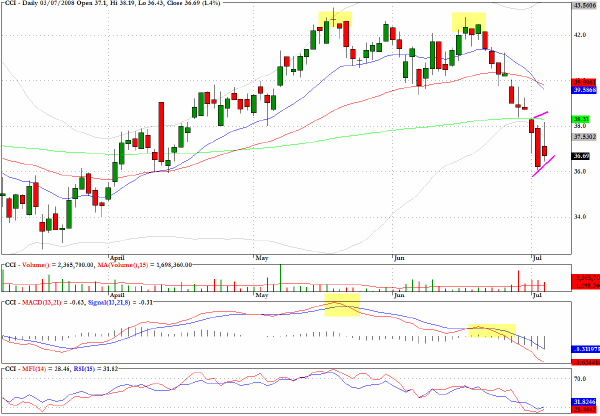
The chart for Crown Castle International (CCI) is displaying evidence of momentum divergences and there is a developing bear flag which should be monitored for potential entry opportunities later in the week.
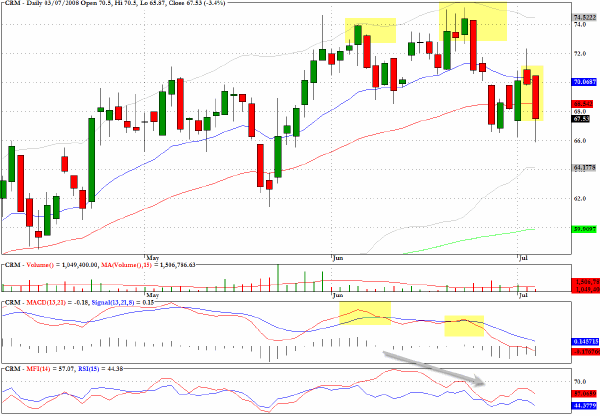
Salesforce.com (CRM) shows a reversal pattern in last Thursday's session with a close below the 50-day EMA, and this takes on a more bearish tone in the context of negative MACD and MFI divergences.
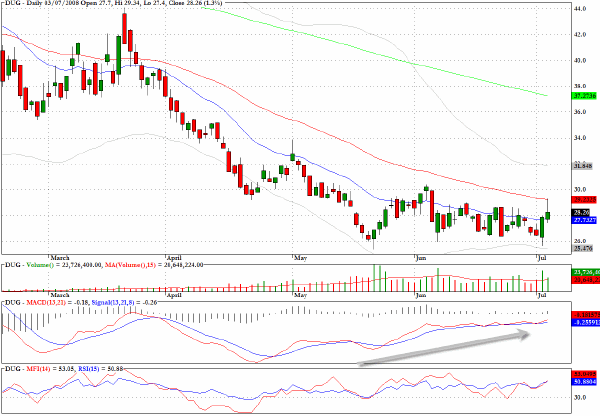
A bold trade to consider this week is to be positioned for a decline in the energy sector but without taking an outright short position in the crude or natural gas market. The ETF vehicle that provides this opportunity allows you to go long the sector fund, DUG, which corresponds to twice the inverse of the daily performance of the Dow Jones U.S. Oil & Gas index.
Notable on the chart is the basing pattern and the possibility for a break above a long standing downward trendline through the highs. Picking a bottom in this inverse fund is not the suggestion, but if the trendline breaks decisively there could be plenty of upside in this short play.
Clive Corcoran is the publisher of TradeWithForm.com, which provides daily analysis and commentary on the US stock market. He specializes in market neutral investing and and is currently working on a book about the benefits of trading with long/short strategies, which is scheduled for publication later this year.
Disclaimer
The purpose of this article is to offer you the chance to review the trading methodology, risk reduction strategies and portfolio construction techniques described at tradewithform.com. There is no guarantee that the trading strategies advocated will be profitable. Moreover, there is a risk that following these strategies will lead to loss of capital. Past results are no guarantee of future results. Trading stocks and CFD's can yield large rewards, but also has large potential risks. Trading with leverage can be especially risky. You should be fully aware of the risks of trading in the capital markets. You are strongly advised not to trade with capital.
|