| Corcoran Technical Trading Patterns For July 8 |
| By Clive Corcoran |
Published
07/8/2008
|
Stocks
|
Unrated
|
|
|
|
Corcoran Technical Trading Patterns For July 8
Whipsaw reversals have characterized the last two sessions with the US indices performing a major about turn in yesterday's trading and the overseas markets flip flopping between strength on Monday followed by renewed selling in today's action.
The Hang Seng more than reversed Monday's gain with an almost 700-point decline in Tuesday's action and currently European markets are headed back to a re-test of last Thursday's lows with two percent plus drops.
Could the market be groping towards a tradable bounce? Some indicators are suggesting yes but when the relentlessly depressing financial news sees major drops in Fannie Mae (FNM) and Freddie Mac (FRE) which highlights the ongoing fears about the whole securitization mess it is hard to see an end to this slow motion crash.
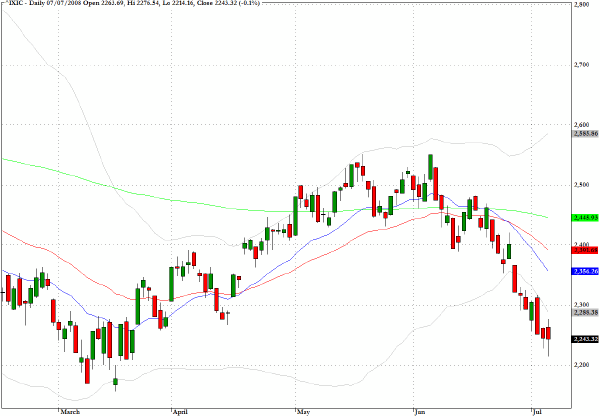
The Nasdaq Composite (^IXIC) could be ready to test its March 17 low in today' session.
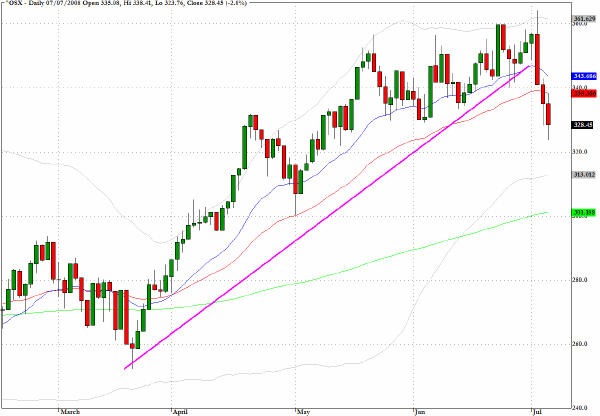
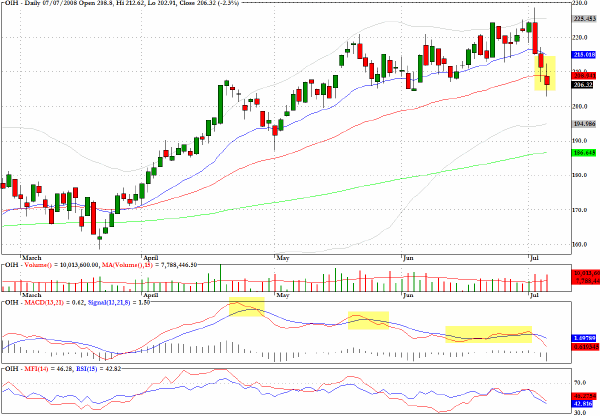
Energy related stocks have been taking a beating in the last few sessions. One index which is showing rather pronounced technical deterioration is the Oil Services Index (^OSX).
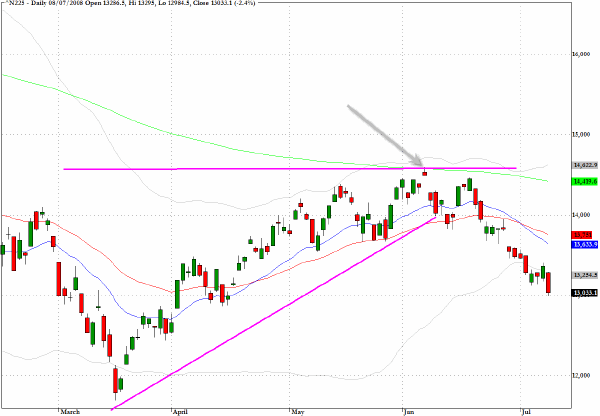
The Nikkei 225 Index (^N225) has failed to hang on to its relatively positive technical condition that was seen even after the mid May peak in US indices. The notable peak for this index which occurred in early June shows a clear failure at the 200 day EMA and this index now seems ready to seek out its mid March low.
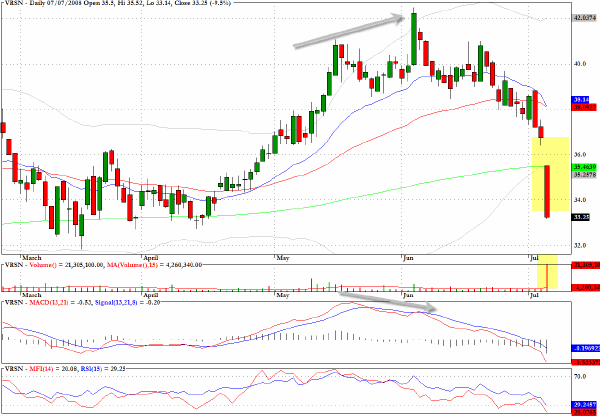
Some time ago I commented that it would be worth monitoring Verisign (VRSN) as the early June peak was evidently not confirmed by encouraging volume and momentum characteristics. The technical divergences were an early warning of the steep drop in yesterday's session.
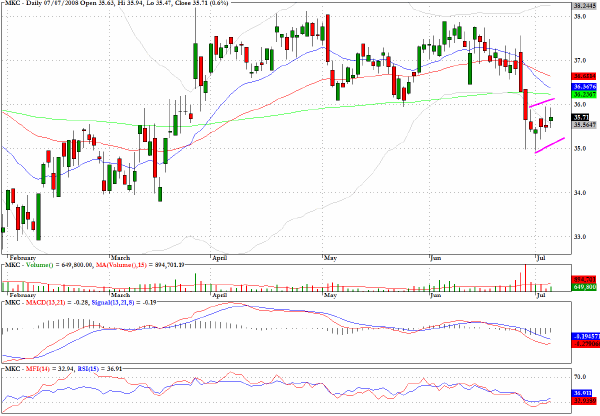
I would be looking at short opportunities for McCormick (MKC) if there is a rally back towards $36.
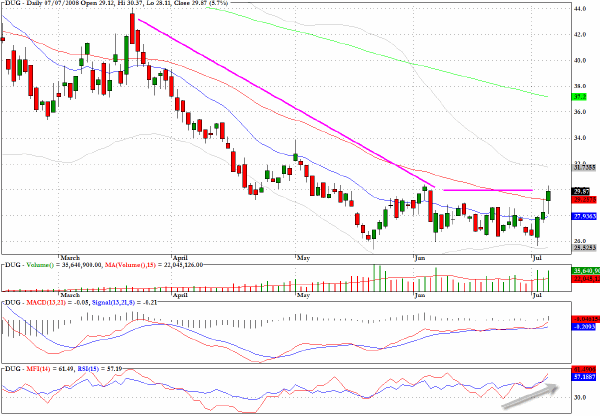
Here again is the comment made yesterday regarding DUG.
A bold trade to consider this week is to be positioned for a decline in the energy sector but without taking an outright short position in the crude or natural gas market. The ETF vehicle that provides this opportunity allows you to go long the sector fund, DUG, which corresponds to twice the inverse of the daily performance of the Dow Jones U.S. Oil & Gas index.
Notable on the chart is the basing pattern and the possibility for a break above a long standing downward trendline through the highs. Picking a bottom in this inverse fund is not the suggestion, but if the trendline breaks decisively there could be plenty of upside in this short play.
The sector fund for the oil services industry, OIH, is mapping the breakdown observed above for the Oil Services Index.
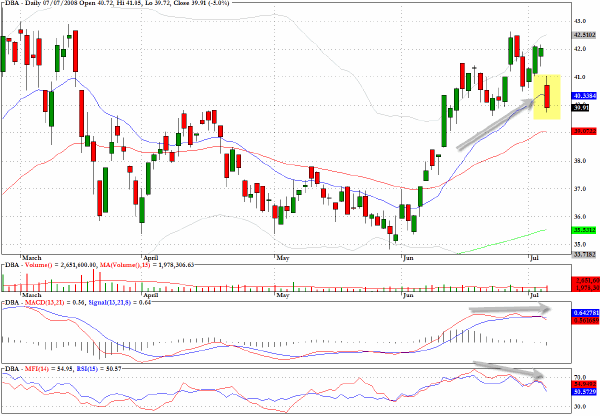
An exchange traded fund which tracks the agricultural sector, DBA, is showing all of the characteristics of an intermediate topping pattern.
Clive Corcoran is the publisher of TradeWithForm.com, which provides daily analysis and commentary on the US stock market. He specializes in market neutral investing and and is currently working on a book about the benefits of trading with long/short strategies, which is scheduled for publication later this year.
Disclaimer
The purpose of this article is to offer you the chance to review the trading methodology, risk reduction strategies and portfolio construction techniques described at tradewithform.com. There is no guarantee that the trading strategies advocated will be profitable. Moreover, there is a risk that following these strategies will lead to loss of capital. Past results are no guarantee of future results. Trading stocks and CFD's can yield large rewards, but also has large potential risks. Trading with leverage can be especially risky. You should be fully aware of the risks of trading in the capital markets. You are strongly advised not to trade with capital.
|