| Corcoran Technical Trading Patterns For July 9 |
| By Clive Corcoran |
Published
07/9/2008
|
Stocks
|
Unrated
|
|
|
|
Corcoran Technical Trading Patterns For July 9
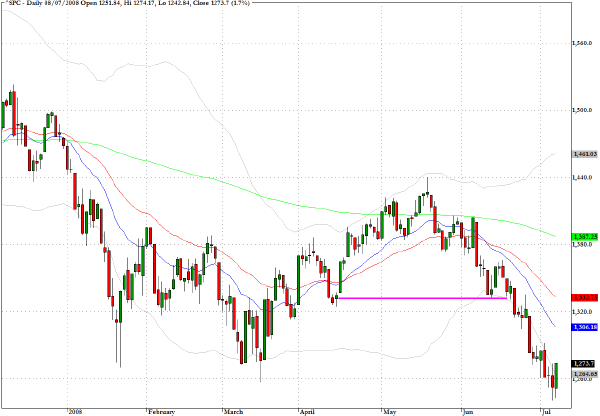
Yesterday's bounce in US equities was not a high volume affair but it could mark a turning of the tide in the near term that could unsettle the complacency that has been developing amongst those holding large short positions in equities.
The S&P 500 (^SPC) turned around just above Monday's intraday low and registered a 1.7% gain for the session. Layers of resistance should present a real challenge in the 1320-1325 region and my sense is that long only fund managers will not be seeing the present market as a buying opportunity, but rather a way of exiting troublesome positions at higher prices.
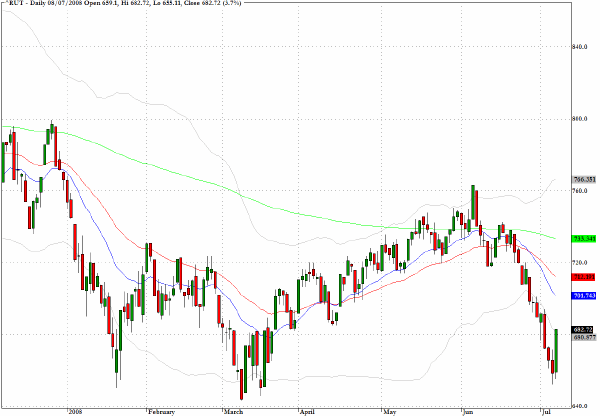
The Russell 2000 (^RUT) jumped by a rather striking 3.7% but much of this seems to have been short covering as, over the last couple of weeks, some traders were aggressively pushing the small caps down in a catch up play with the larger cap stocks.
One notable feature of Asian trading that recently completed Wednesday's session, was the performance of the Nikkei 225 which gapped up on the open, following the US rally, but in the latter part of the session the Japanese index gave up all its early gains to end the session essentially flat.
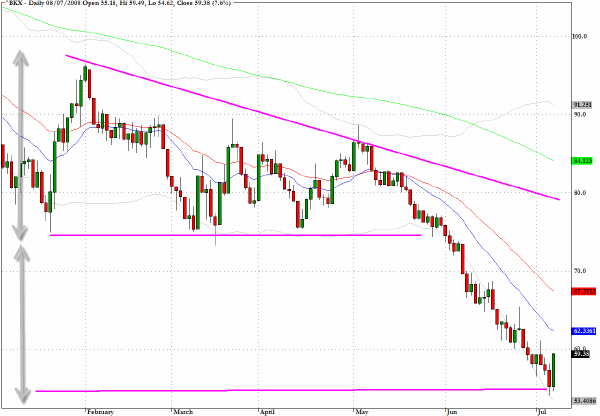
The banking index (^BKX) finally bounced in a fairly sharp manner after dropping just below the 56 level I discussed last week based on the descending wedge symmetry hypothesis that I have tentatively advanced.
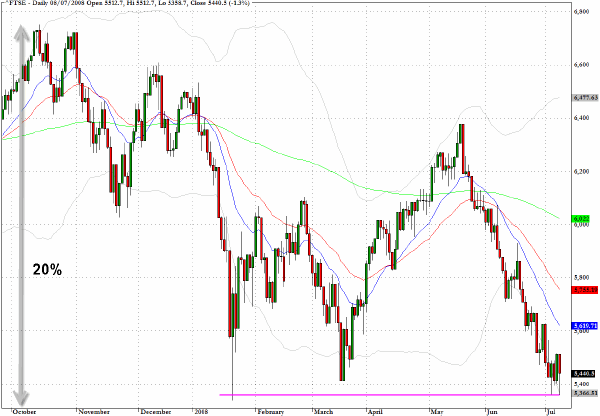
The economic news in the UK is getting gloomier by the day and the FTSE index officially registered a bear market decline during yesterday's trading. We have now made a rather obvious triple bottom pattern in the region of 5350.
So are we all done now? If so, it would be the neatest end to a bear market on record.
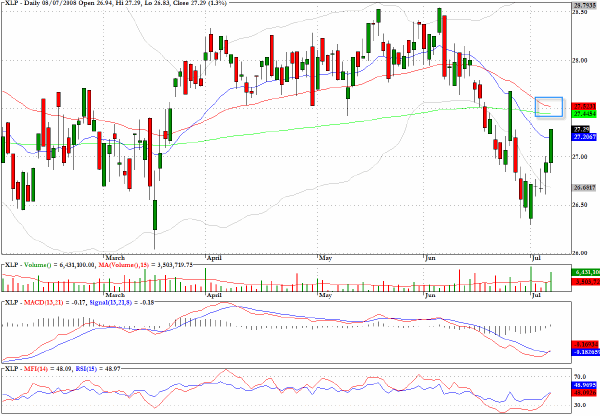
The exchange traded fund for the consumer staples sector, XLP, has performed a trend reversal but has to break through potential resistance from the 50 and 200-day EMA's. If it can make it through this barrier there is also strong chart resistance at the $28 level.
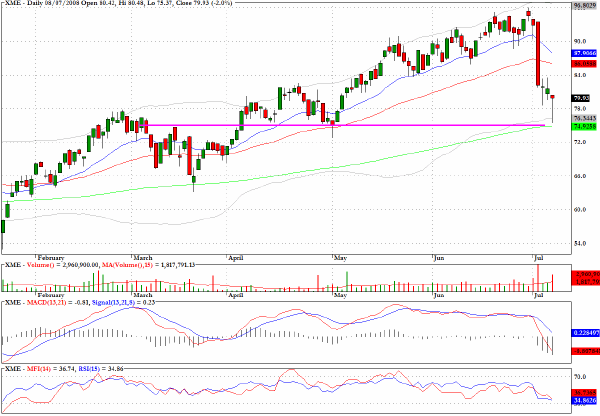
The SPDR Metals and Mining sector fund, XME, sank further yesterday following Monday's plunge but the intraday low tagged the 200-day EMA and an area of chart support.
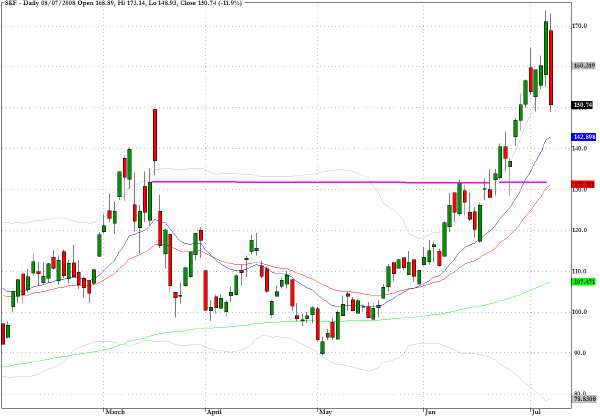
SK,F which is an inverse leveraged tracker of the financial sector, was one of the big losers in yesterday's rally. A fairly obvious downside target is in the region of 130.
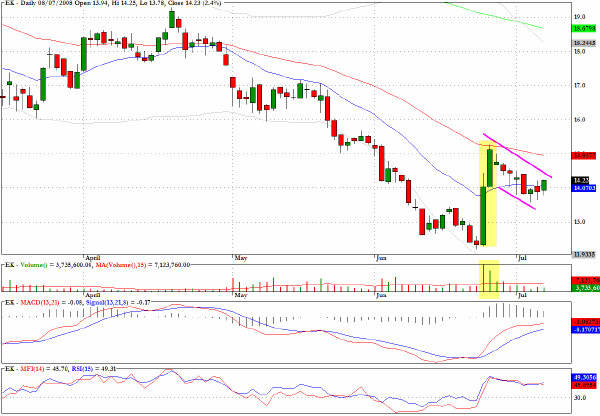
Eastman Kodak (EK) has a bull flag pattern and should benefit from any overall market rally continuation.
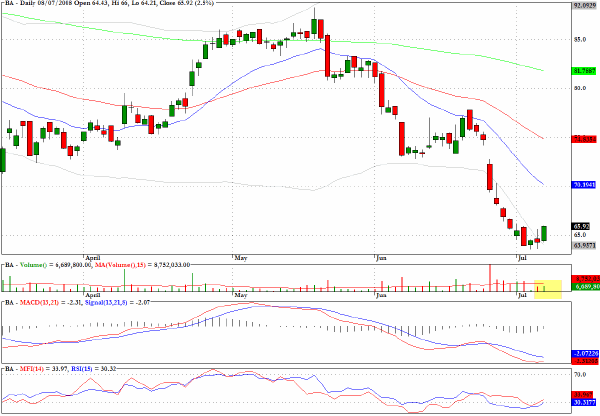
The reason for including the chart for Bank of America (BAC) was to illustrate the rather anemic volume seen in some of the financials that rallied yesterday.
Clive Corcoran is the publisher of TradeWithForm.com, which provides daily analysis and commentary on the US stock market. He specializes in market neutral investing and and is currently working on a book about the benefits of trading with long/short strategies, which is scheduled for publication later this year.
Disclaimer
The purpose of this article is to offer you the chance to review the trading methodology, risk reduction strategies and portfolio construction techniques described at tradewithform.com. There is no guarantee that the trading strategies advocated will be profitable. Moreover, there is a risk that following these strategies will lead to loss of capital. Past results are no guarantee of future results. Trading stocks and CFD's can yield large rewards, but also has large potential risks. Trading with leverage can be especially risky. You should be fully aware of the risks of trading in the capital markets. You are strongly advised not to trade with capital.
|