| Corcoran Technical Trading Patterns For July 10 |
| By Clive Corcoran |
Published
07/10/2008
|
Stocks
|
Unrated
|
|
|
|
Corcoran Technical Trading Patterns For July 10
Yesterday's sell-off typifies the kind of frustrating action that is sure to discourage the bottom fishers who keep trying to call the beginnings of the rebound rally.
Today I intend to cover the weekly charts for a number of US indices on CNBC's Power Lunch Europe and there are some interesting and surprising differences.
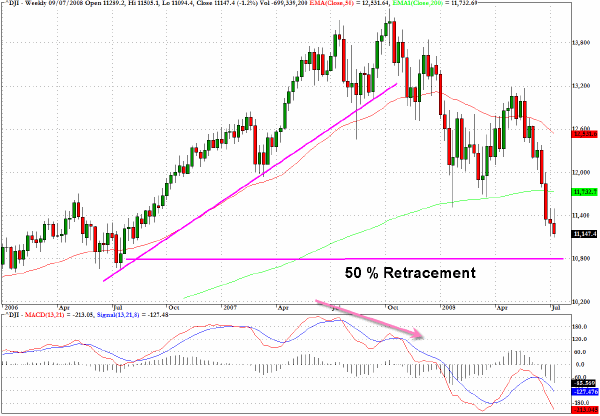
To begin, the technically weakest index is the Dow Jones Industrials (^DJI). Looking at the weekly MACD indicators it is very clear how the October 2007 was convincingly unconfirmed by the momentum indicator. Looking to the right of the chart the current MACD levels are not providing any suggestion of a positive divergence, unlike some of the other indices to be discussed.
In terms of key retracement levels, if we take the entire move from the March 2003 low up to the October 2007 high, the 38% retracement of that move is in the region of 11,630. Clearly the index has lost contention with that level and this puts the 50% retracement in play. The region to keep an eye on is 10,750 or thereabouts which is also an area of chart support going back to the May 2006 sell-off
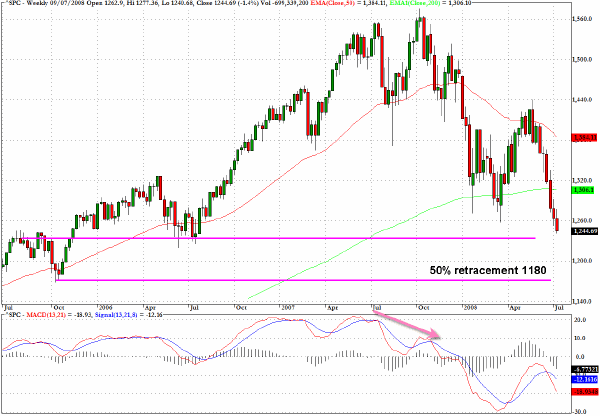
The S&P 500 (^SPC) has a slightly more positive complexion from a technical point of view. The close yesterday was the lowest close in two years exceeding Tuesday's close (although the intraday low did not exceed that seen on Tuesday).
The index has broken below the 38% retracement level which is approximately 1270 and now the 1180 level which is a 50% retracement level has to be considered. Unlike the DJIA there is more clustering of price action in the 1240 level and if we were to see a near term reversal in this vicinity it would put a more positive slant to the weekly MACD picture on the right hand side of the chart.
My intuition here is that we are coming close to a rally which could take us back towards the 1350 level (although 1325 will be a major obstacle) but the next leg down, which could emerge during the fall, will take us to lower levels, perhaps even below 1180.
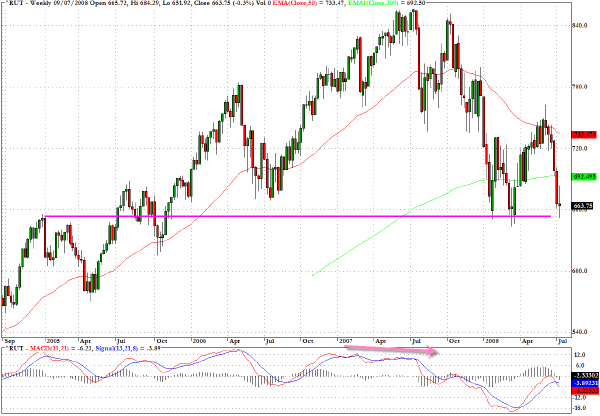
One of the odd characteristics of the slow motion crash that we have been seeing is that it we are not seeing small and midcaps in the vanguard of the decline. Rather it is the larger cap stocks, that feature prominently in index futures strategies that are leading the charge downwards.
The Russell 2000 (^RUT), despite the recent catch up still seems to have the greatest bounce potential. On Tuesday we saw this index jump by 3.7% and even yesterday's sell-off stopped short of recent lows.
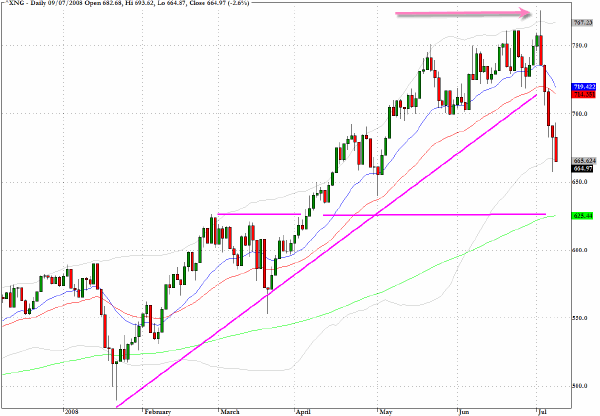
The Natural Gas Index (^XNG), following the trend-line break in early July has clearly entered a significant correction. Although some consolidation and relief could arise in coming session the 625 level on this index looks like it will be tested.
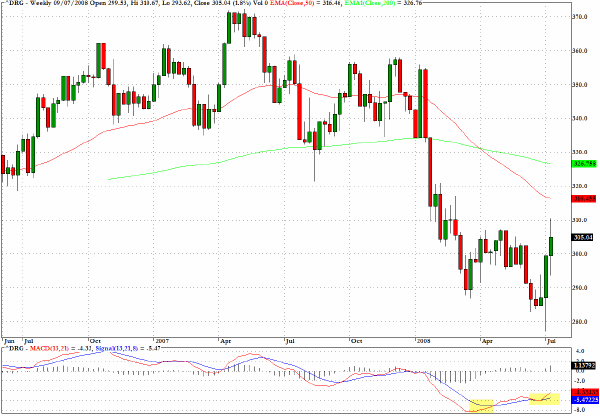
One of the few indices that has quite straightforward positive divergences is the Amex Pharmaceutical index (^DRG).
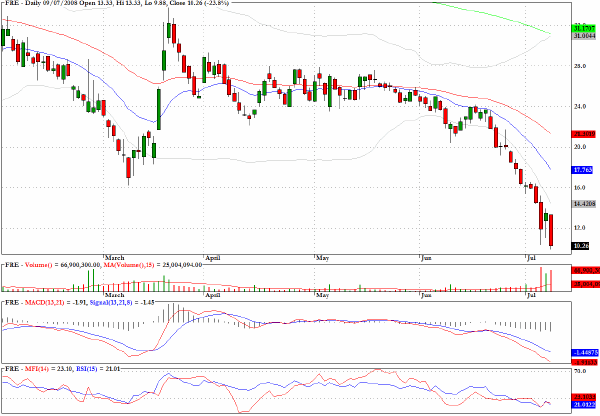
Freddie Mac (FRE) is continuing in a free fall and is registering new multi year lows.
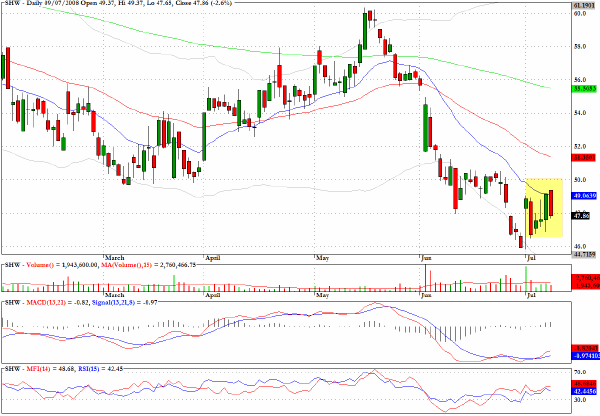
Sherwin Williams (SHW) along with most stocks has experienced substantial whipsaws, but the positive technical pattern noted here last week is still intact.
Clive Corcoran is the publisher of TradeWithForm.com, which provides daily analysis and commentary on the US stock market. He specializes in market neutral investing and and is currently working on a book about the benefits of trading with long/short strategies, which is scheduled for publication later this year.
Disclaimer
The purpose of this article is to offer you the chance to review the trading methodology, risk reduction strategies and portfolio construction techniques described at tradewithform.com. There is no guarantee that the trading strategies advocated will be profitable. Moreover, there is a risk that following these strategies will lead to loss of capital. Past results are no guarantee of future results. Trading stocks and CFD's can yield large rewards, but also has large potential risks. Trading with leverage can be especially risky. You should be fully aware of the risks of trading in the capital markets. You are strongly advised not to trade with capital.
|