| Weekly Outlook In The Stock Market |
| By Price Headley |
Published
07/14/2008
|
Stocks
|
Unrated
|
|
|
|
Weekly Outlook In The Stock Market
NASDAQ Composite
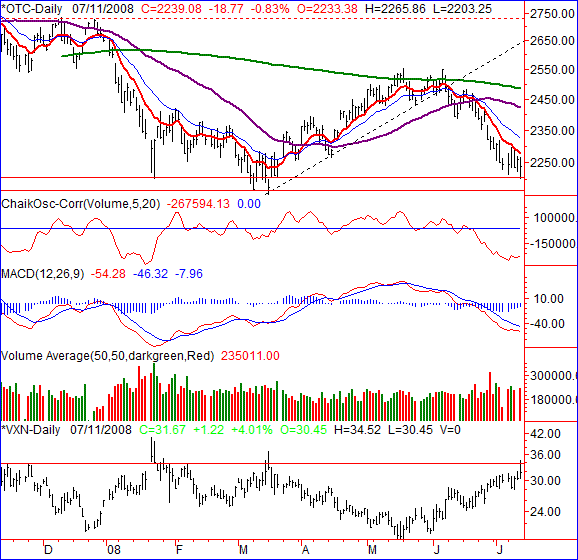
The NASDAQ performed better than the rest of the major market indices on Friday, only losing 0.83%, or 18.77 points. On a weekly basis, again it did much better than most others, only losing 6.30 points, or 0.28%. The composite ended the day at 2239.08, using the week to mostly consolidate.
Just for the record, the 10-day moving average line (red) is still the key. The composite has been sent lower each time it's been touched over the last four weeks. Until we see it cross that line (at 2277), we don't want to get giddy. However, you'll also notice Friday's low, which was part of mostly sideways trading for the week, matched January's bottom. Both the Chaikin line and MACD lines also are starting to curl higher. Above all else, the VXN hit peak levels assocaited with short-term bottoms. The point is, the underlying dynamic is starting to change.
NASDAQ Composite chart - Daily

S&P 500
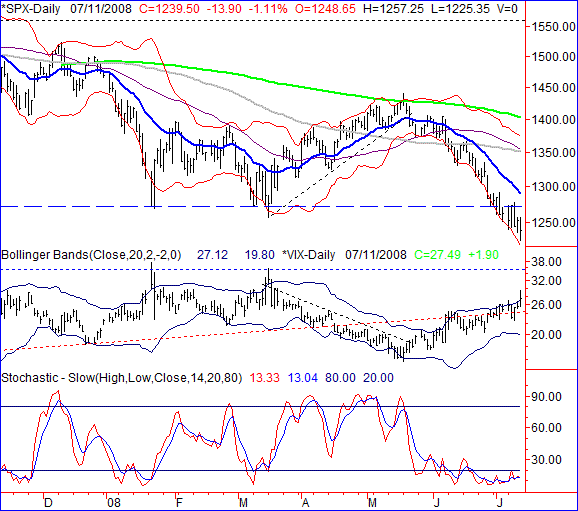
The 1.11% tumble (-13.90 points) for the SPX left it at 1239.50 on Friday. That was 1.85% (-23.40 points) below the previous week's close -- the fifth losing week in a row, not to mention one of 7 losing weeks for the last 8. However, that may be about all the bears can dish out for the time being.
We're not even going to discuss the SPX chart, save one item, stochastics. The index is way oversold, and has been for a while. The market just isn't likely to let that problem last too long. The actual 'signal' will be the point when both stochastic lines move back above 20.
What we really wanted to focus on was the VIX, and what is did NOT do. It did NOT reach levels around 35, like it did the last two times the market bottomed. It did, however, make a decent relative peak at 29.44. That may well be all we're going to get right now. The peak was accented by a pullback to a close of 27.12 on Friday. We expect that to be enough to jump-start what is at least a decent recovery on the order of days. A move to 1350 is possible/likely. That's where the 50- and 100-day lines are right now, so we'll reassess if and when we get there.
S&P 500 chart - Daily

Dow Jones Industrials
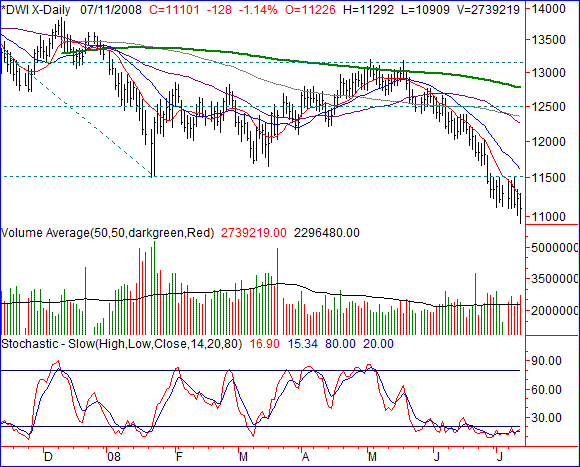
The Dow Jones industrial Average almost reached two-year lows on Friday before coming back to close at 11,101. That was still a 128 points loss (-1.14%) dip for the day though. For the week, the blue-chip index sank 188 points, or 1.67%.
Like the NASDAQ, the Dow's 10-day moving average line (red, currently at 11,268) is the real key to a bullish move. It's literally been the ceiling for the better part of the last month or so. A couple of closes above it, paired with a bullish hint from stochastics, may well signal a rebound up to the 12,250 area.
Dow Jones Industrials chart - Daily

One more thing, the Russell 2000 index actually made a big 4.5 point (+0.67%) gain on Friday. For the week, it was up 1.37%, or 9.15 points. Small caps on the rise in this environment is anything but bearish. Add it to the list of reasons we expect some upside strength for a while.
Price Headley is the founder and chief analyst of BigTrends.com.
|