| Corcoran Technical Trading Patterns For July 14 |
| By Clive Corcoran |
Published
07/14/2008
|
Stocks
|
Unrated
|
|
|
|
Corcoran Technical Trading Patterns For July 14
There is a plethora of commentary and opinions about what is the real significance of the turmoil created by Fannie and Freddie to be found on financial blogs. Some of the comments are truly apocalyptic and others seem to think that the turnaround in the stocks, especially in FRE in late trading Friday, suggests that the tide is about to turn for the financials.
My own contribution to the discussion is that it is hard not to be entirely cynical about the derisory claims being made during Thursday's session that the two GSE's were adequately capitalized. Between the two of them there is about $80bn in capital and yet they are on the hook for about $5 trillion in mortgage guarantees. It would only take a one and a half percent failure rate in the mortgages they have under-written to wipe out all of their capital, and clearly the US government had no choice but to step up to the plate and formalize the nature of the implicit guarantees.
I would stay away from being tempted to guess the likely direction of the equity in these rescues, but in general it seems that we have now reached a point where there is a more fundamental issue that should be now staring the markets in the face. The fact is that the US government is not adequately capitalized. Current yields on Treasuries will need to go higher and/or the US dollar will need to go lower to persuade those holders of real as opposed to phantom capital, to put it at risk in propping up many US "securities".
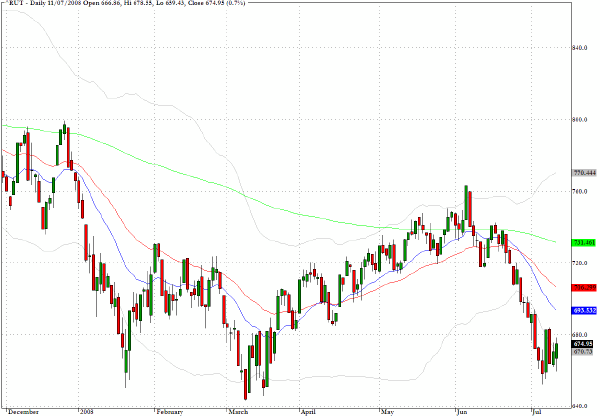
The Russell 2000 (^RUT) managed to make a 0.7% gain in Friday's session validating the view expressed here last week that this small cap index is still in contention with the 38% retracement level of the whole move since the spring of 2003. This section of the market represents a place to be if you still have any interest in the long side of the market (even as one leg in an index pairs play).
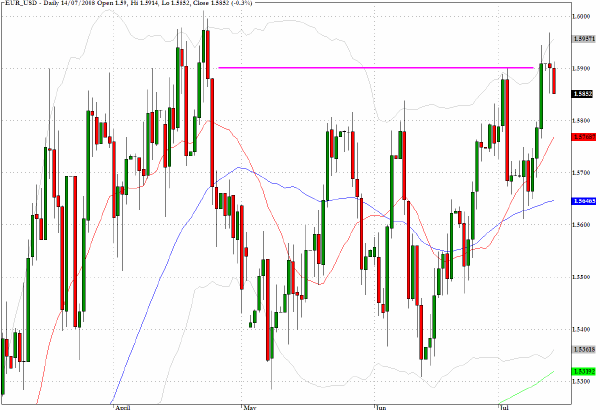
The Euro moved above the $1.59 hurdle in trading on Friday but has slipped back in Asian and European trading as this is being written. For real clues as to the "re-pricing" of the appetite for US debt by global asset managers this is the rate to watch this week. A break above $1.60, which seems very probable, could lead to more nasty sessions for US Treasury bonds and equities.
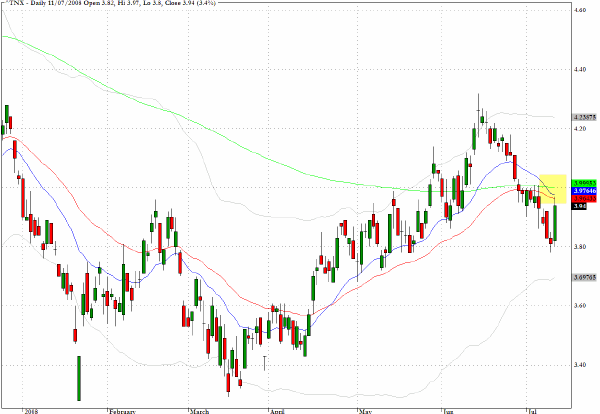
In Friday's trading, the Treasury bond complex did not perform as is usually the case when there are panic-like conditions in the stock market. Yields went up as bonds across the whole yield curve sold off. Concerns about increased supply as Uncle Sam is forced to underwrite even more of the legacy of several years of financial engineering and a growing sense that the underlying risk of US Treasuries saw an uptick in yields.
The four percent level shows as an area of overhead resistance, but as suggested in relation to the Euro/USD cross rate if the markets are having difficulty in digesting the rescue of the GSE's, a break back above a 4% yield could mark a turning point in the business as usual inflation/recession saga, and would suggest that global capital flows are starting to price in the increased risk of being in US government debt.
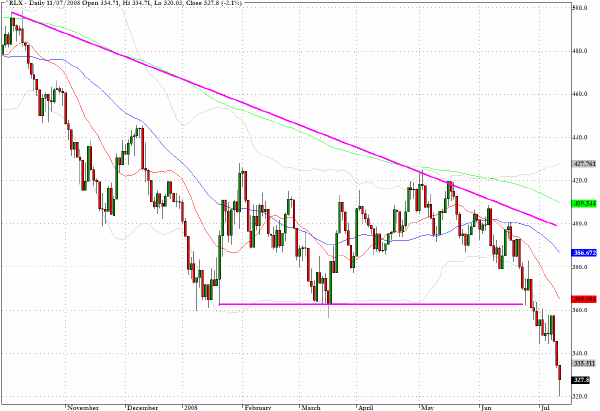
Another illustration of the fundamental bearishness of certain segments of the market is clearly visible in the break-down of the S&P Retail Index (^RLX) since the violation of the "triple" bottom that formed the baseline of the descending triangle pattern.
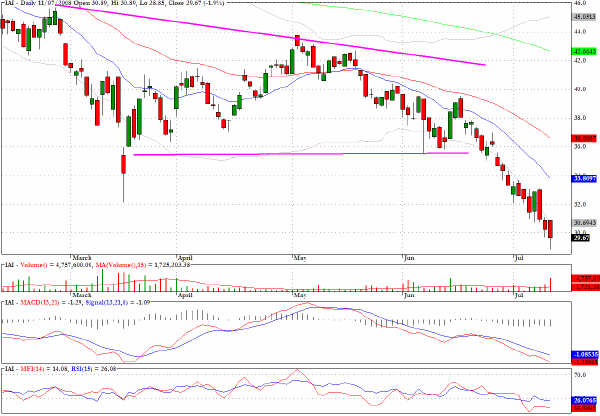
The sector fund for the US brokers/dealers, IAI, once again illustrates the break down from the descending wedge pattern discussed here in early June. This sector will come under even more pressure as its business model is now clearly going to come under further scrutiny from increased Treasury/Fed participation in any of the debt securitization business that they engage in on a going forward basis.
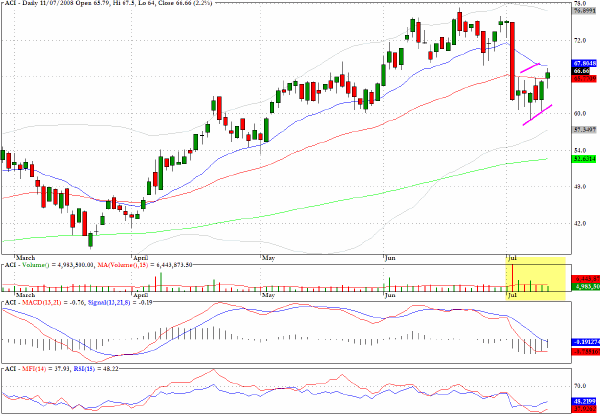
Arch Coal (ACI) has a very well formed bear flag pattern unfolding and entry opportunities on the short side would be even more attractive on any rally today.
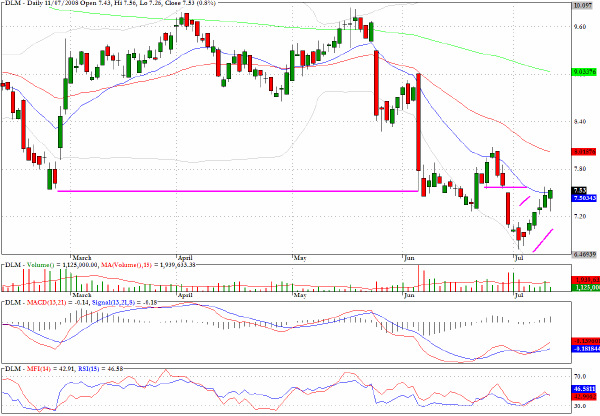
I would be looking for entry opportunities on the short side for DelMonte (DLM) as the $7.80 level is approached.
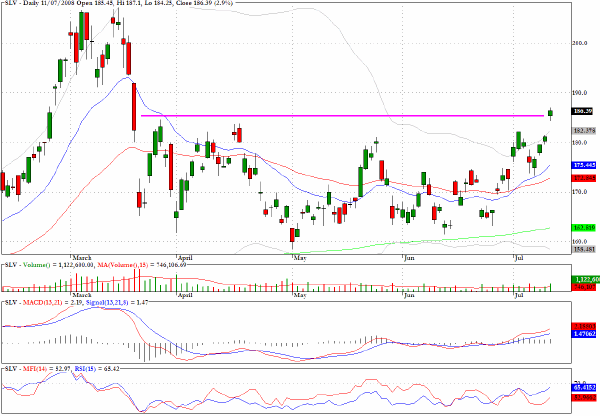
The exchange traded fund for Silver, SLV, has a constructive technical pattern and a break above $183 (equates to $18.30 per ounce of the spot price) would suggest a return to the early March levels above $200.
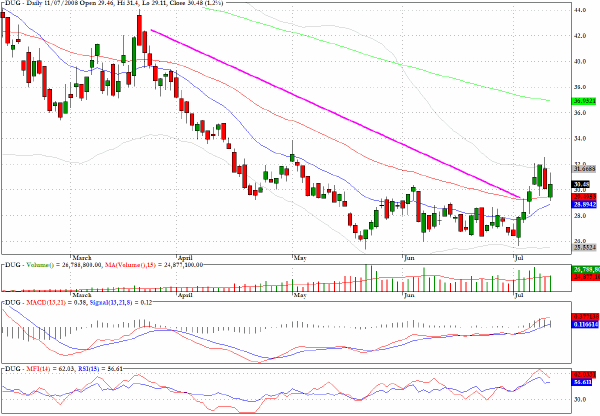
One way to be positioned for a decline in the energy sector without taking an outright short position in the crude or natural gas market is to build a long position in the exchange traded fund, DUG.
This fund corresponds to twice the inverse of the daily performance of the Dow Jones U.S. Oil & Gas index.
Last Thursday the price broke through the downtrend through the highs and Friday's whipsaw behavior highlights how this trade is certainly not going to be smooth sailing. Buying the fund near to Thursday's low, or the close by 50-day EMA, could provide a low risk/reward proposition if the energy sector is topping out temporarily.
Clive Corcoran is the publisher of TradeWithForm.com, which provides daily analysis and commentary on the US stock market. He specializes in market neutral investing and and is currently working on a book about the benefits of trading with long/short strategies, which is scheduled for publication later this year.
Disclaimer
The purpose of this article is to offer you the chance to review the trading methodology, risk reduction strategies and portfolio construction techniques described at tradewithform.com. There is no guarantee that the trading strategies advocated will be profitable. Moreover, there is a risk that following these strategies will lead to loss of capital. Past results are no guarantee of future results. Trading stocks and CFD's can yield large rewards, but also has large potential risks. Trading with leverage can be especially risky. You should be fully aware of the risks of trading in the capital markets. You are strongly advised not to trade with capital.
|