Although we talked about this briefly in the Weekly Market Outlook, I thought it would be worth another look after Monday's rally.....if only because it became so well defined. What we're talking about is the resistance that the S&P 500 and the Dow are likely to be running into by the time you read this. Isn't this something more for our chart-oriented newsletters? Yeah, but I think this is important enough to discuss here today. It's also more important than the media may realize as of yet.
What we're talking about is the approach toward resistance levels, for the S&P 500 as well as the Dow. Let's look at the Dow Jones Industrial Average first.
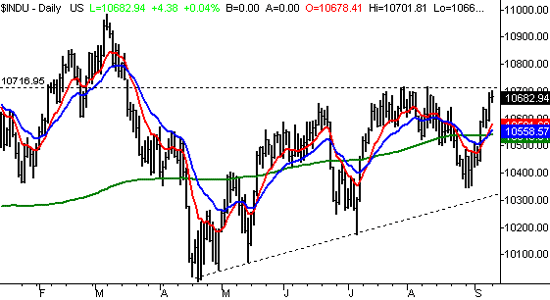
Back in July and August, the Dow - on two separate occasions - ran right up to the 720 level, but failed to move above it. Instead, both instances led to substantial pullbacks. Yesterday's high was 10,701, less than 20 points away from that resistance level.....it's also on the verge of getting to a six month high. For the Dow, 20 points is next to nothing, so we're quite close to a significant breakout move. Past resistance at 10,720, the next potential stopping point in this year's high of 10,984. Take a look at the chart, then read on for our take on the S&P 500.
Dow Jones Industrial Average - Daily

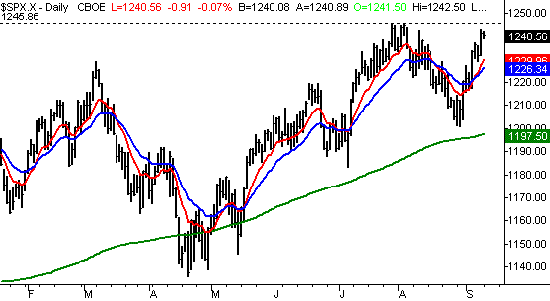
But the real milestone is visible on the S&P 500's chart. Like the Dow, the SPX is right on the verge of breaking above July's/August's highs around 1245. On Monday, the S&P 500 closed at 1240.56, and had actually been as high as 1242.50 (and as high as 1243.13 on Friday). That five points, much like the Dow, is nothing for the S&P to gain in even less than a day. So again, a breakout is on the horizon. But take a closer look. A move above 1245 would also be a new 52-week high for the S&P 500. That's a big deal. Often times, once investors see a market act strong enough to move into uncharted territory, the bulls finally get excited enough to rush in in a big way. That means a big rally could be in the works. For the sake of full disclosure, the last few times that 52-week highs were hit, the following rally wasn't terribly big. BUT, it was still big enough to want to be a part of. Just keep the idea in your back pocket if the index creeps up past that recent high of 1245.
S&P 500 - Daily

As always, keep it all in perspective. We haven't broken resistance yet, and the reality is that we may not. But if we do, it could be a big deal. On Thursday, we'll take a look at the short-term vulnerability of the market right now. It may be just enough of a liability to keep the indexes contained, rather than rallying.
On a side note, the NASDAQ isn't really close to breaking above recent highs, nor reaching a new 52-week high. When the composite gets closer to those levels, we'll discuss it here.
Price Headley is the founder and chief analyst of BigTrends.com.