| Corcoran Technical Trading Patterns For July 16 |
| By Clive Corcoran |
Published
07/16/2008
|
Stocks
|
Unrated
|
|
|
|
Corcoran Technical Trading Patterns For July 16
Once again the US market failed to deliver the climactic session that many technical analysts are calling for to mark the inflection point from which a tradable rally might emerge. The tone during the morning session when Chairman Bernanke was testifying suggested at one point that traders were increasingly critical of the regulators' attempts to prop up the mortgage market specifically and the capital markets in general.
Perhaps the most telling criticism of the day's proceedings which included testimony from Treasury Secretary Paulson as well, came from members of the Banking Committee who wanted to know whether there was an upper ceiling to the extent to which the Fed was prepared to support Fannie Mae and Freddie Mac. No upper limit was specified and this brought the following response from a Republican senator - "The treasury secretary is asking for a blank cheque to buy as much Fannie [Mae] and Freddie [Mac] debt as he wants for this unprecedented intervention in our free markets."
It is not so much the blank cheque for the debt that it is worrying but the fact that there also appears to be no upper limit to how much of the GSE's equity the US government stands ready to buy. The debt holders, including Uncle Sam, may be sound but shareholder equity could effectively be diluted away to virtually zero. Not really the way to manage the world's most important financial system.
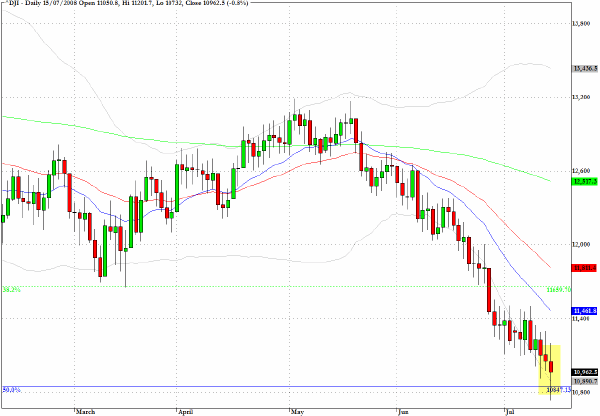
The DJIA pierced below the 10750 level that I have been targeting but since it was an intraday print the suspicion is that it will needed to be tested more robustly again on a closing basis.
This strikes me as a high risk market on the short side, but equally I am not yet ready to play for a bounce. Accordingly most of the commentary today will be reviewing some recent comments.
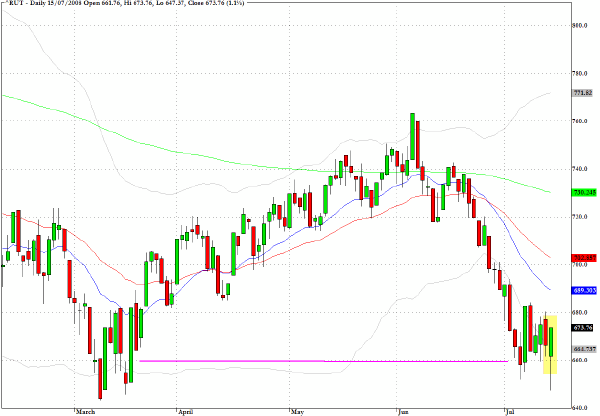
Another index level that I have been focused on, and which I discussed in a recent appearance on CNBC Europe, is the 660 level on the Russell 2000 (^RUT). This level represents the 38% retracement of the March 03-October 07 range and is showing strong indications that it wants to hold. The resilience of the small cap index is one of the more healthy aspects of this otherwise gloom obsessed market.
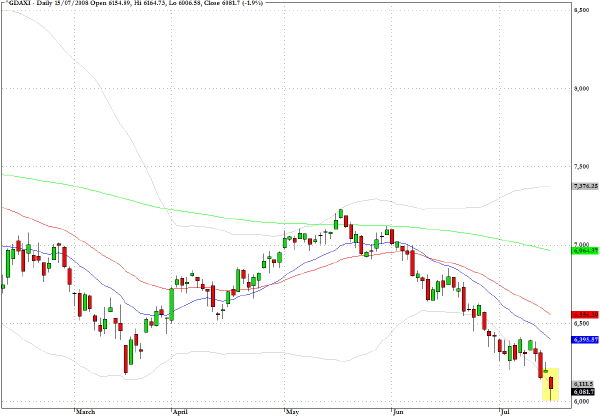
The DAX index (^GDAXI) also hit an important intraday target yesterday when it bounced just above the 6000 level. I recently suggested that a bounce at 6200 seemed likely, which we actually saw for a couple of sessions last week, but also suggested that a break below this level could expose the German market potentially to downside targets nearer to 5300.
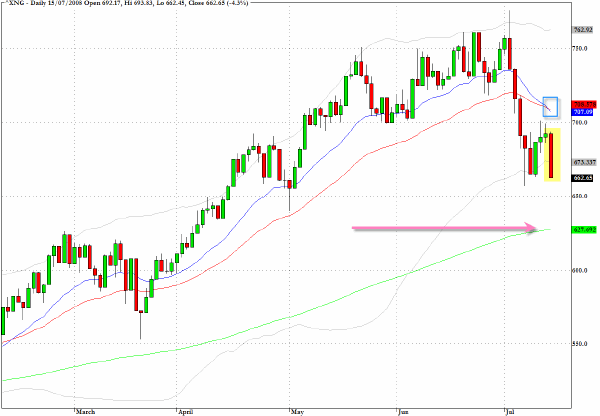
Also as discussed on the CNBC interview last week the Natural Gas Index (^XNG) was ready to drop sharply from the mini pullback pattern. After failing to break above the convergence of the 20 and 50-day EMA the 625 level still seems likely as the next target.
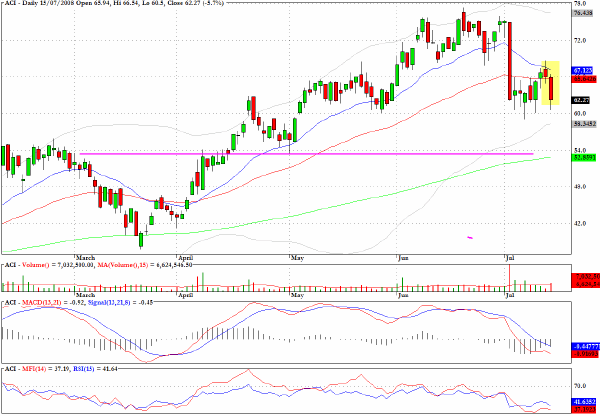
Following up on one of Monday's suggestions, Arch Coal (ACI) provided a good entry opportunity on the short side in Monday's trading just above the 20-day EMA. Establishing a position there, or even on yesterday's open would have delivered a more than five percent return in yesterday's trading.
Just to reiterate comments made on Monday.
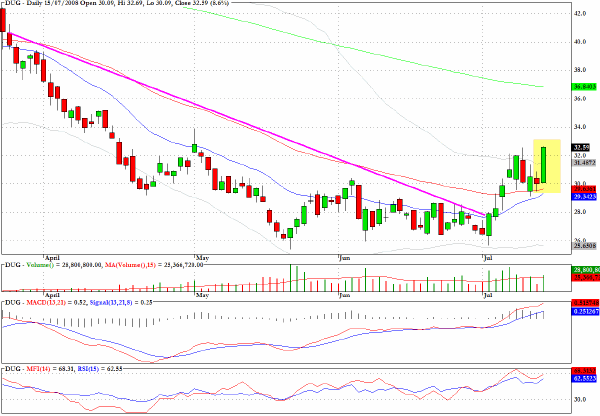
One way to be positioned for a decline in the energy sector without taking an outright short position in the crude or natural gas market is to build a long position in the exchange traded fund, DUG.
This fund corresponds to twice the inverse of the daily performance of the Dow Jones U.S. Oil & Gas index.
Buying the fund near to the 50-day EMA, could provide a low risk/reward proposition. The fund gained almost 9% yesterday.
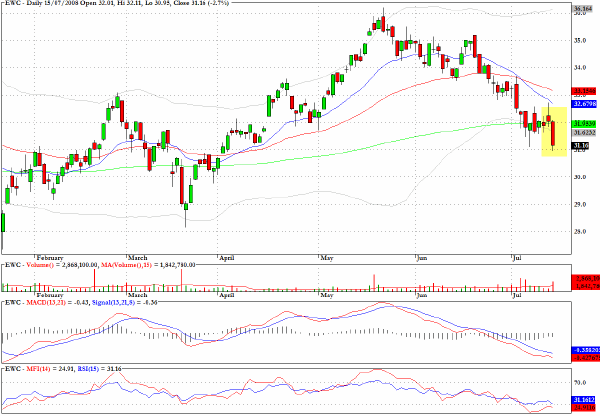
Resource-focused economies/stockmarkets will be relatively more exposed to a contraction in world demand for commodities. Yesterday, EWC, which tracks the MSCI Canada index, fell below key support at the 200-day EMA on expanded volume.
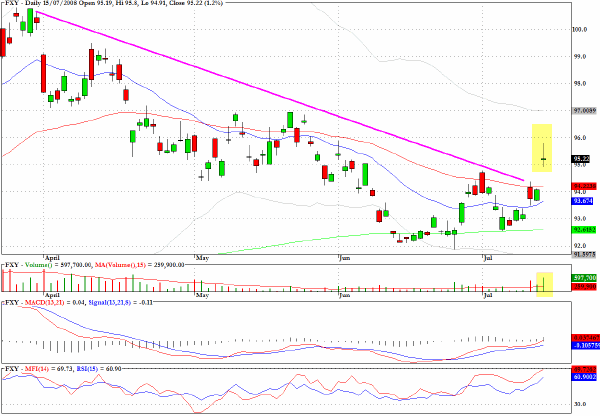
Another recent recommendation, made on June 30, seems to be worth revisiting. Against the US dollar the chart below shows that the Japanese currency could be ready to break above a long term downtrend. If this is sustainable this could also add further disruption to global capital flows.
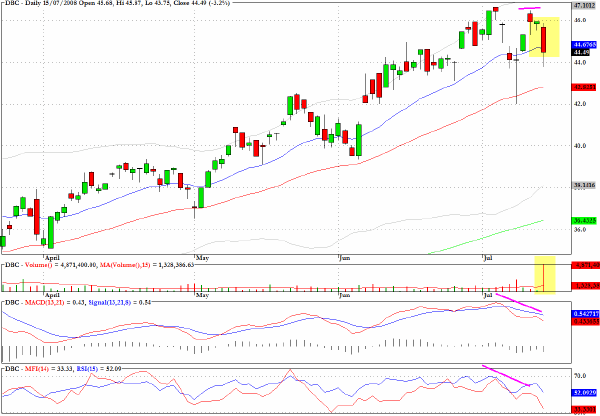
One of the more interesting exchange traded funds for the commodity sector is DBC which is revealing evidence of a topping process. The fund is primarily exposed to the futures market prices of WTI (West Texas Intermediate), Gold, Aluminum, Wheat, Corn and Heating Oil.
Shorting this fund could certainly expose traders to whipsaw behavior, but there is plenty of reward potential on the downside as long as the risk is managed appropriately.
Clive Corcoran is the publisher of TradeWithForm.com, which provides daily analysis and commentary on the US stock market. He specializes in market neutral investing and and is currently working on a book about the benefits of trading with long/short strategies, which is scheduled for publication later this year.
Disclaimer
The purpose of this article is to offer you the chance to review the trading methodology, risk reduction strategies and portfolio construction techniques described at tradewithform.com. There is no guarantee that the trading strategies advocated will be profitable. Moreover, there is a risk that following these strategies will lead to loss of capital. Past results are no guarantee of future results. Trading stocks and CFD's can yield large rewards, but also has large potential risks. Trading with leverage can be especially risky. You should be fully aware of the risks of trading in the capital markets. You are strongly advised not to trade with capital.
|