| Possible Large Downside Still Looms |
| By Price Headley |
Published
07/16/2008
|
Stocks
|
Unrated
|
|
|
|
Possible Large Downside Still Looms
Amid the recent market decimation and horrible fundamental news from many areas, I currently see a setup for a short-term bounce in the S&P 500 Index. After this bounce, which I would speculate would be a few weeks in length and would take us to the 1300ish level on the S&P 500, I would prepare for another possible big leg down.
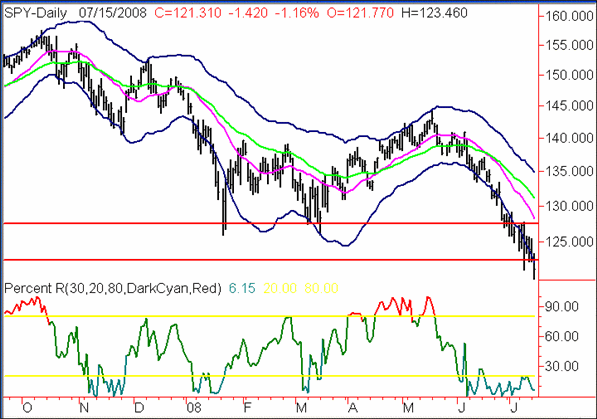
If you examine the following daily chart of the S&P 500, you can see that we have been at or below the bottom Acceleration Band for some time now. We have broken both the key 1275 and 1225 levels, although we are back above 1225 today. This is obviously a bearish chart - and the intra-day action I have seen in the market has been terrible on most days recently (early and late day sell-offs). But an extended run at or below the bottom band for a stock or index is usually indicative of a short term bounce - the other logical possibility is a sharp one or two day crack to the downside.
S&P 500 Index Daily Chart

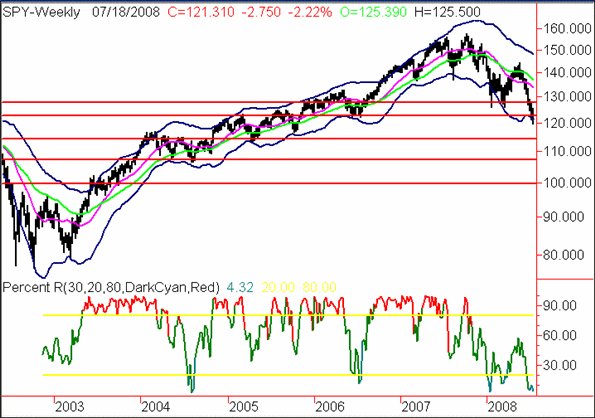
On the weekly chart, I see a good possibility of a short-term bounce. The short-term bounce would come from the fact that we have finally reached the bottom Acceleration Band on a weekly basis - combined with consistent time below the daily Bottom Band. This is a likely spot for a short-term bounce, or at least a sideways market.
After a bounce or consolidation from here, in the long-term compressed weekly chart, I see the potential for the major correction to continue, down to as low as 1000. This would be over a 20% drop from the current low levels. I have drawn some support level lines going back to 2002. These are various significant lows from each year. We have already broken the 2006 lows; the next level of support is around the 1150ish level from 2005. Below that, we have 1075ish from 2004. A severe breakdown could take us down to the key 1000 round level last breached in 2003. This is not a guarantee obviously, but this is the kind of chart where we can see a major quick spike down to multi-year lows, in my view. The ultimate fear bottom may coincide with a VIX spike up to as high as 50ish - too many people are waiting for the VIX spike around 30 or 35, that may be too low and too many people watching it.
S&P 500 Index Weekly Chart

To sum up, I've seen terrible technical action recently, combined with awful fundamental news and a lack of sentiment indicators reaching a peak of fear - not a good recipe. However, as many have noted, we are severely oversold and due for a bounce ? the Acceleration Bands are pointing to a likely short-term bounce soon. After that, I still see a risk of a further major correction. I would advise to prepare for a short-term rally up to maybe 1300/1350 on the S&P 500 Index, but after that to consider buying puts for protection (and profit) or selling upside call credit spreads, and also consider buying Ultra Short ETFs to profit from further downside potential.
Price Headley is the founder and chief analyst of BigTrends.com.
|