| Corcoran Technical Trading Patterns For July 17 |
| By Clive Corcoran |
Published
07/17/2008
|
Stocks
|
Unrated
|
|
|
|
Corcoran Technical Trading Patterns For July 17
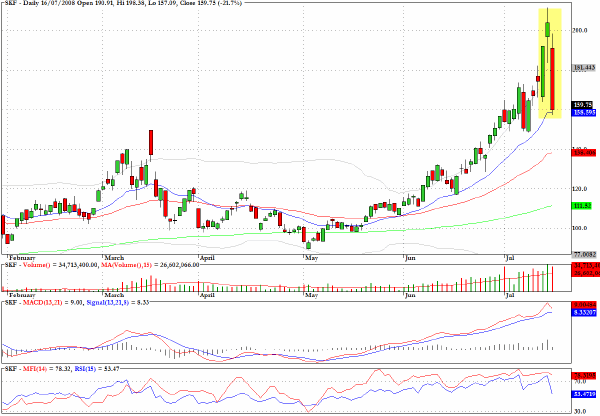
The chart below suggests that the capitulation event that many analysts have been waiting for actually occurred in Tuesday's trading. SKF is the inverse leveraged tracker for the financial services sector, and if the chart is turned upside down the panic low as it were would correspond to Tuesday's candlestick. Also from the upside down perspective this would be a good example of the morning star pattern.
Certainly the range covered and the magnitude of the price change yesterday suggests that the financial sector should bounce further. But the volume was not climactic and bottom fishers in the banks have been disappointed several times recently.
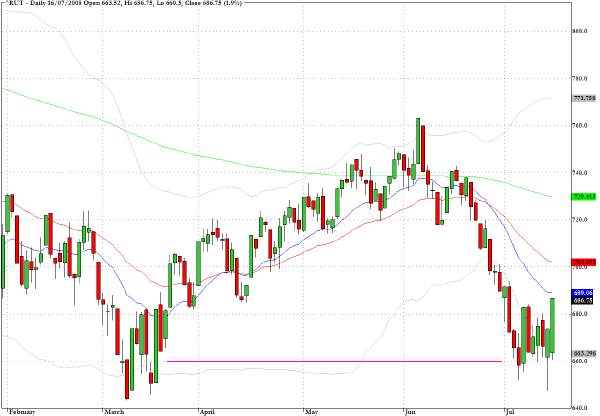
The Russell 2000 (^RUT) has been a useful barometer in suggesting that some fund managers were not despairing of the long side. The 660 level proved to be a formidable support level although, not surprisingly in view of the massive degree of short covering that was taking place yesterday, it was the larger cap stocks that had the most ground to make up.
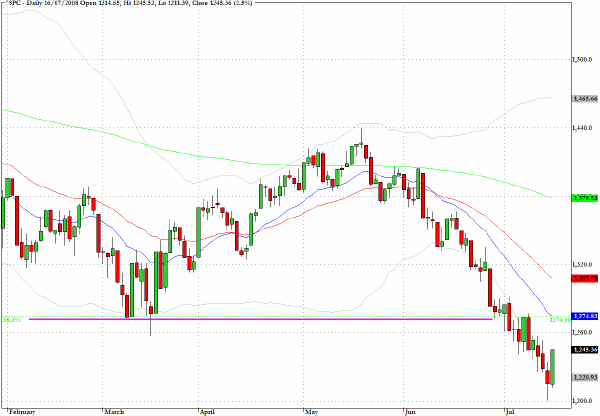
The S&P 500 (^SPC) needs to confront several layers of resistance at 1275 (the 38% retracement level) and chart congestion in the region of 1280. Volume on the SPY contract was not as strong as might have been expected and reinforces the notion that much of the action yesterday was being lead by index futures traders and involved inter-market strategies with currencies and crude.
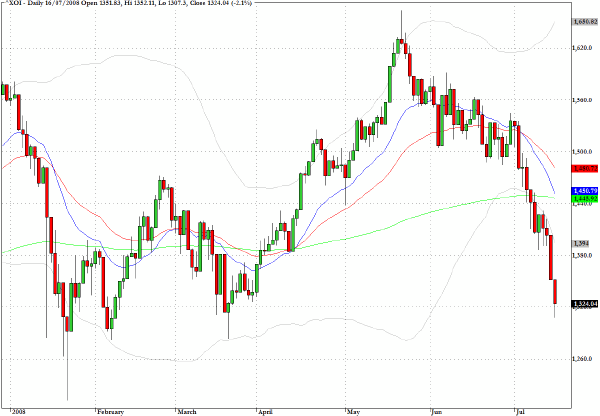
The Oil Index (^XOI) may be reaching potential support levels near 1270.
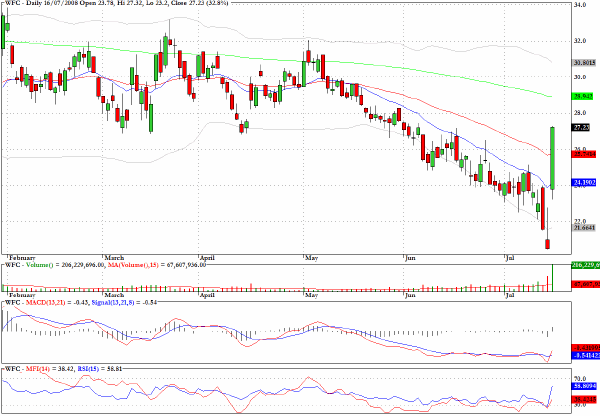
Yesterday's chart for Wells Fargo (WFC) is quite extraordinary. When a bank stock moves up almost one third of its value in one session there should be pause for re-evaluating traditional notions of what stocks qualify as volatile and candidates for a low/medium risk portfolio.
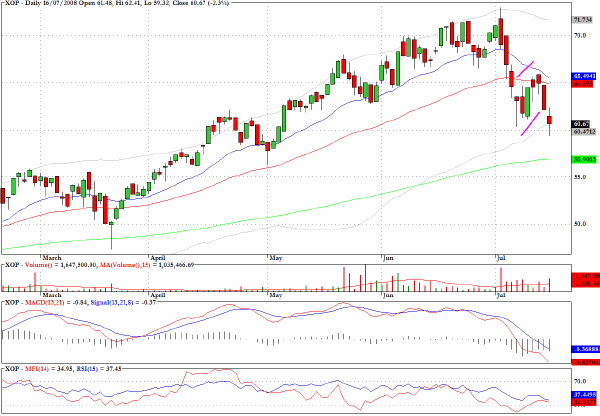
Discussed here in Tuesday's commentary, XOP, the exchange traded fund that is derived from the oil and gas exploration and production portion of the S&P index, has performed well on the short side after registering a well defined bear flag and negative divergences during June.
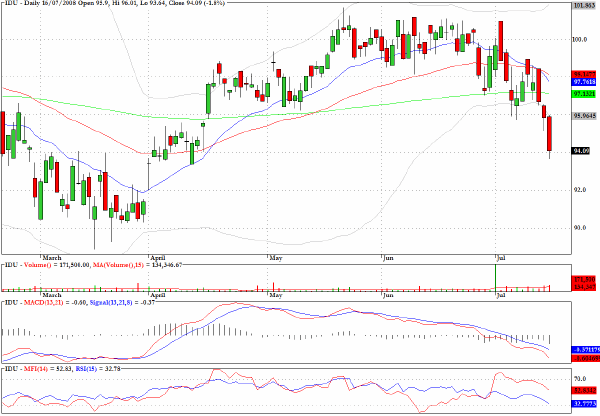
Apart from energy-related stocks, one section of the market that was a major casualty yesterday was the utilities sector. IDU, which tracks the Dow Jones Utilities, has decisively fallen below all three moving averages and seems headed for a test of the 90 level. Investors in the utilities were undoubtedly paying a lot more attention to the alarming CPI numbers released yesterday than those traders that were scrambling to cover short positions in the financials.
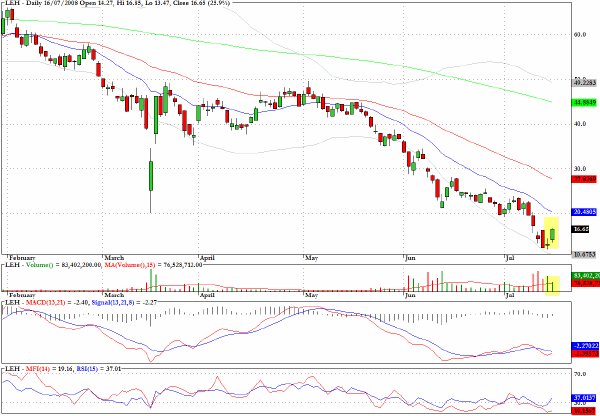
Lehman Brothers (LEH) gained 25% yesterday although as the chart reveals this very large move seems dwarfed by the magnitudes of the recent plunges in the stock. Volume was below average and the focus by the company's CEO, Richard Fuld, on short sellers could reinforce some skeptics in the view that this is being used by the bank as a diversionary tactic.
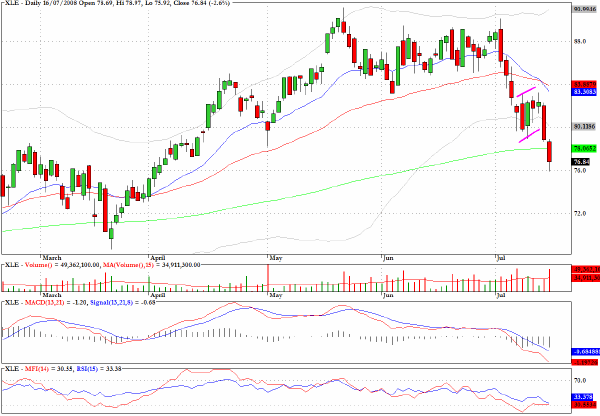
The SPDR Energy sector fund, XLE, dropped below the 200-day EMA on strong volume yesterday. There is clear evidence of a bear flag pattern but the intuition is that much of the easy money may have been made on the short side in the near term.
Clive Corcoran is the publisher of TradeWithForm.com, which provides daily analysis and commentary on the US stock market. He specializes in market neutral investing and and is currently working on a book about the benefits of trading with long/short strategies, which is scheduled for publication later this year.
Disclaimer
The purpose of this article is to offer you the chance to review the trading methodology, risk reduction strategies and portfolio construction techniques described at tradewithform.com. There is no guarantee that the trading strategies advocated will be profitable. Moreover, there is a risk that following these strategies will lead to loss of capital. Past results are no guarantee of future results. Trading stocks and CFD's can yield large rewards, but also has large potential risks. Trading with leverage can be especially risky. You should be fully aware of the risks of trading in the capital markets. You are strongly advised not to trade with capital.
|