| Weekly Outlook In The Stock Market |
| By Price Headley |
Published
07/21/2008
|
Stocks
|
Unrated
|
|
|
|
Weekly Outlook In The Stock Market
NASDAQ Composite
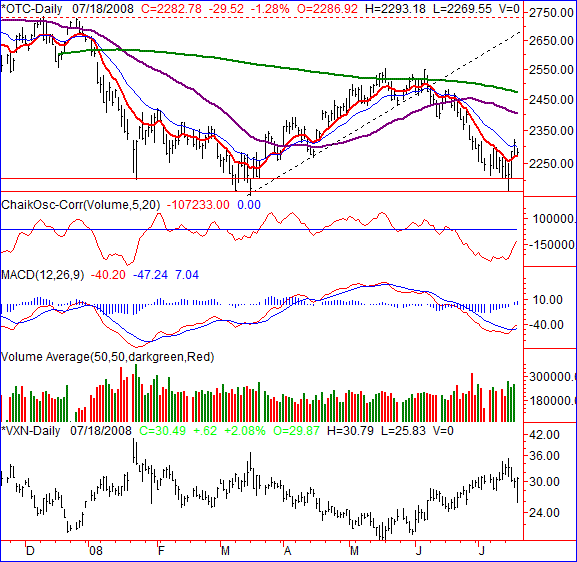
On Friday the NASDAQ composite sank 29.52 points (-1.28%) to end the day at 2282.78. Google gets most of the blame for that. For the week though, the composite still managed to gain 1.95% (+ 43.7 points). Despite the disastrous Friday, the NASDAQ actually wasn't the worst performer for the week.
Still, the last three days of this past week are a very encouraging sign of at least a little more upside. Friday's pullback was stopped at the 10-day moving average line which acted as support.
As we mentioned last week, there were a couple of things we wanted to see happen before we really got fully bullish. One was a MACD crossover, which is now in place. The encouraging part about this bullish move is that it was backed by stronger volume.
From here we're looking for a move to 2400 or so. That's where the 50-day moving average line is right now. That may only be a checkpoint though; the 200-day line at 2472 is the really big hurdle.
Side note: Wednesday's low of 2167.29 is strangely close to March's low of 2155.42, and also very close to the next nearest low of 2168.67. The point is, a lot of institutional traders may have been waiting for the market to just brush that level before stepping in again. There's nothing to do about that now, but tuck that pattern away in your mental file.
NASDAQ Composite Chart - Daily

S&P 500
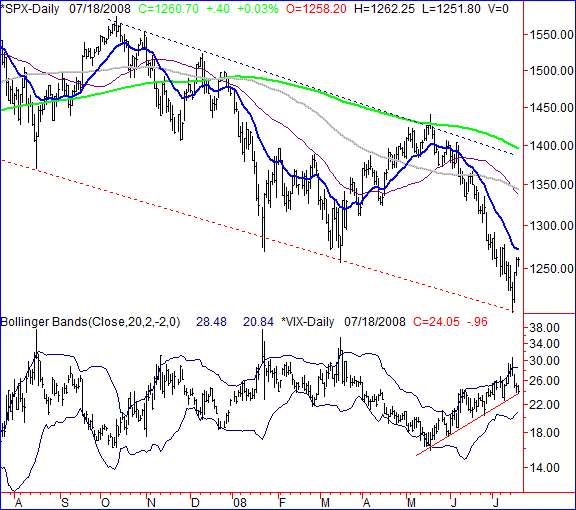
The S&P 500 barely eked out a gain on Friday, closing 0.4 points higher (+ 0.03%) to end the session at 1260.7. On a weekly basis, the large cap index closed 1.71% higher than the prior week's close, or + 21.2 points. We think more of the same is on the way.
There are a variety of reasons we think this, with the most obvious one being results.
First of all, take a look at the VIX. We finally got that elusive spike with Tuesday's peak at 30.81.
Along the way, something else popped up that we thought was interesting. Take a look at the red dashed line on the chart Tuesday's low was the fourth node of a long term support line. This level as support was not apparent or likely until just this week. Going forward though, you can bet we'll be watching it.
However, if we plot that support line, then we also have to plot the corresponding resistance line. That's the dark dashed line above the S&P 500's bars. What's interesting about that resistance line is how it closely coincides with the 200-day moving average line. (The 200-day line has been a ceiling more than once in the last several months.)
We're looking for this index to at least rally up to 1330 or so, and possibly even up to that upper resistance level. Beyond that, we'll really have to think long and hard.
There's only one near-term liability we see, and that is again the VIX. If you look at the VIX chart over the last 2 1/2 months, you can see a support line has been made (red, solid). The VIX actually closed right on that line Friday. If it breaks down as support this coming week then great- the bulls can continue. And, that's what we expect. It's worth keeping an eye on though.
S&P 500 Chart - Daily

Dow Jones Industrial Average
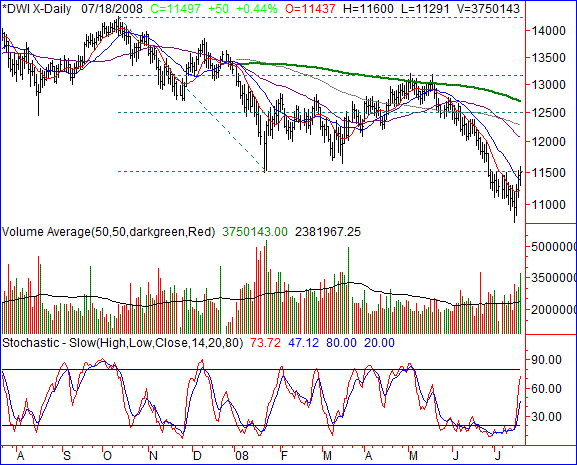
The harder they fall the faster they bounce. So, with the Dow being the biggest loser between May and June, it should be no surprise the same index was this past week's biggest gainer. The Dow Jones Industrial Average rallied 50 points on Friday (+ 0.44%) to end the day at 11,497. For the week though, the blue chip index regained 3.57% (+ 396 points).
Like all the rest of the indices, there still a lot more room for recovery. In the Dow's case, we don't see any headwinds until roughly 12,100, where the 50-day and 100-day moving average lines are. The heavy-duty resistance won't kick in until above 12,500. That still leaves room for about a 9% gain from where we are now.
Only a close above 12,900 would really clinch some major bullishness.
Dow Jones Industrial Average Chart - Daily

Price Headley is the founder and chief analyst of BigTrends.com.
|